Tag Archives: investing ideas

Crisis Alpha: Surprising Ways To Hedge Stock Portfolio Risk
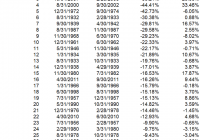
By Wesley R. Gray Investing in the current environment is difficult. Most, if not all, asset classes have high nominal prices, suggesting low nominal expected returns. Not exactly exciting. And for many investors who are retired and/or have near-term liquidity needs, investing in equity exposures – while necessary to generate higher expected returns – also prevents many investors from sleeping at night! One solution to curb the risk of a massive market meltdown is to buy portfolio insurance. However, in a rational world, insurance contracts are expensive because they protect us when we need protection the most. Insurance has this pesky problem of charging a large premium for downside protection. For example, consider put options on the S&P 500 market index. If an investor wants to hedge against a 10% drawdown for a year, the cost (as of August 13, 2015) would be approximately 4% of the notional value to be hedged. So if you had a $1,000,000 stock portfolio and wanted to ensure the most you could lose was $100,000, the cost of that insurance for one year would be around $40,000. Clearly, buying portfolio insurance can be expensive. But what if we could identify unique assets where the cost of insurance was much lower? We’ve identified 3 candidates that may fit this profile: US Treasury Bonds Hedge Fund Factors Managed Futures We highlight some of the historical evidence of the abilities of these assets to provide portfolio insurance (they go way up, when stock markets go way down). Of course, past performance is no guarantee of future performance, and nobody can know what will happen in the future, but the results inspired us to dig a little deeper and think harder about our own portfolio construction efforts. 1. US Treasury Bonds The results below highlight the top 30 drawdowns in the S&P 500 Total Return Index from 1927 to 2013. Results are gross of management fees and transaction costs. All returns are total returns and include the reinvestment of distributions (e.g., dividends). Next to the S&P 500 return is the corresponding total return on the 10-Year (LTR) over the same drawdown period. Bottom line: When the market blows up, flight-to-quality 10-Years have done well. (click to enlarge) The results are hypothetical results and are NOT an indicator of future results and do NOT represent returns that any investor actually attained. Indexes are unmanaged, do not reflect management or trading fees, and one cannot invest directly in an index. Additional information regarding the construction of these results is available upon request. 2. Hedge Fund Factors We examine 3 common hedge fund “factor” portfolios alongside the S&P 500 Index: S&P 500 = S&P 500 Total Return Index HML = The average of 2 value portfolios (small and large) minus the average return of two growth portfolios (again, small and large) MOM = The average of 2 high return portfolios (small and large) minus the average return of two low return portfolios (small and large) QMJ = The average of 2 high-quality portfolios (small and large) minus the average return of two low-quality portfolios (small and large) Results are gross of management fees and transaction costs. All returns are total returns and include the reinvestment of distributions (e.g., dividends). Data are from AQR and Ken French . Next to the S&P 500 return is the corresponding total return on hedge fund factors over the same drawdown period. Bottom line: When the market blows up, hedge fund factors have done well. (click to enlarge) The results are hypothetical results and are NOT an indicator of future results and do NOT represent returns that any investor actually attained. Indexes are unmanaged, do not reflect management or trading fees, and one cannot invest directly in an index. Additional information regarding the construction of these results is available upon request. 3. Managed Futures Here we examine a chart from a white paper by the folks at AQR. The paper is called, “A Century of Evidence on Trend-Following Investing.” The trend-following concept analyzed can be considered a generic managed futures strategy. Bottom line: When the market blows up, trend-following managed futures have done well. (click to enlarge) The results are hypothetical results and are NOT an indicator of future results and do NOT represent returns that any investor actually attained. Indexes are unmanaged, do not reflect management or trading fees, and one cannot invest directly in an index. Additional information regarding the construction of these results is available upon request. Conclusion Historically, Treasury Bonds, Hedge Fund Factors, and Managed Futures have all managed to act like portfolio insurance, even though they aren’t traditionally considered insurance assets. Will this pattern continue in the future? Who knows…and of course, that is the million dollar question… Let us know if you’ve seen other hidden portfolio insurance options out there. Please share ideas… Original Post


Correlated Risk? Or Opportunity?

In my weekend research report I write for my clients, I shared a few thoughts on correlation. This is a timely topic-we may be entering a period of the market history where a lot of assets link together. This is a risk, as there’s always the risk of getting smacked in the face when (previously) non-correlated markets snap into lockstep, but there’s another side to this, as well. Correlated risk can drive exceptional performance, for those traders who understand the risks, can fully accept those risks, and manage them appropriately. Here’s the snippet I wrote over the weekend: (click to enlarge) Correlation is a concept that is often misunderstood and much-abused in thinking and writing about financial markets. This week, we need to devote a few words to the concept of correlated risk and how to manage these risks, but, first, a few thoughts on correlation and some potential issues with the measure: Think carefully Correlation is well-understood mathematical measure, but, as in so many cases, applications to financial markets can often encourage sloppy thinking. On one hand, perhaps too much attention is focused on correlation, and this is likely a side effect of correlation’s importance in constructing portfolios; expected future correlation of assets is one of the key inputs in portfolio models, and here we arrive at one of the first issues. Few people, outside of those who have done quantitative work and study on financial market data, appreciate how variable correlations can be. Stocks are put into portfolios with the idea that they are “high beta” or “low beta” (beta is a measure of the amount of a stock’s movement that is attributable to the broad market), but, depending on what time window we measure, a stock’s beta might fluctuation between 2.0 and -1.0 within the course of a few years. Even supposedly well-established rules of thumb, such as the Dollar’s correlation to other asset prices, stock markets’ volatility’s (inverse) correlation to price movements, are highly variable. Furthermore, correlation does not show what most casual market participants might expect. It is easy to look at two lines on the chart that go in roughly the same direction and say “they must be highly correlated.” Maybe, but maybe not. Correlation can be highly deceptive when extrapolated to other time periods; it is trivial, for instance, to construct two price series that are perfectly -1.0 inversely correlated, yet both “go up” over a longer time period. (See this blog post for an example.) Last, two points that will be familiar to readers with a mathematical background, but that bear repeating: correlation does not imply causation. Every statistics student learns this in the first class she takes, but we are all vulnerable to drawing unsupportable conclusions in the heat of battle; we cannot hear this reminder too often. Second, correlation measures linear relationships. In many cases, linear correlation has application to non-linear relationships, but just be aware that relationships between markets could potentially be much richer and more complex than could be captured in a measure of correlation. Correlated portfolio risk These points are interesting (and important), but the practical issue of correlated risk demands attention. Put very simply, we put on different positions in a trading book or portfolio with the idea that they are all independent bets-some may win, some may lose, but they will each “do their own thing.” Correlated risk is the risk that, for some reason, all of these positions move in the same direction at the same time. Why might this happen? It is well-established, through decades of market history, that correlations tend to move toward 1.0 in times of market stress . These are not rare events; they happen several times each decade when supposedly unconnected assets all move in the same direction, usually led by mini-crashes in stock prices. In retrospect, there’s always some “obvious” connection, but psychology is the driver. Market participants become scared and basically scramble for the exits all at the same time. However, risk is a double-edged sword, and one of those edges works for us. Risk is the companion of opportunity, and, in fact, we can reduce our job to taking on the right kinds of risk and managing them appropriately. Over a long period of time, many traders find that their returns tend to be concentrated in certain time periods; this is true both of discretionary traders and of trading systems in test and design. During these periods, risks tend to high and correlated, but there is an important lesson here. Accepting these correlated risks can lead to outsized returns. We may wish it were otherwise, but trading and investing are uncertain games of chance. We may wish for steady returns and a rising equity curve that looks like a straight line (or an exponential curve), but reality is messier. Reality is periods of feast and famine, and correlated risks typically are high in the rich periods. We should be aware of these risks and manage them, but we should see them for what they are-a real risk with real potential rewards and, potentially, a major driver of potential outperformance.

5 Huge Advantages You Have Over Professional Investors

Summary 5 ways you are better than the Wall Street pros. Why you should ignore what the pros are doing. How to take advantage of your advantages. “Don’t bother. The professionals are better than you and they know something you don’t.” Really? There’s some truth to that, but there’s plenty of lies mixed in that short statement too. And it’s easy to dismiss yourself or come up with excuses for why you can’t do it. Here are five to get things started. 5 Common Excuses That Investors Believe The market definitely knows more than me. I’m not smart enough to invest on my own and build wealth. I always miss out on the best opportunities. I can’t beat the computer trading that the market uses. I don’t know where or how to start. Sure there’s some validity to each excuse above. But investing is unique because anyone can be a good investor. The Uniqueness of the Stock Market Outside of the stock market, it’s a good idea to find a professional to solve a problem instead of trying to do it yourself or asking the average Joe next door. Need a kidney transplant? Find a surgeon. Not Ms. Traci, your old biology teacher. But the investment industry is one of the very few where you don’t need any qualification, practice, skill or even knowledge to be involved in the markets. The entry criteria is zero, which is why so many people lose money, throw their hands in the air and forever condemn the stock market as a rigged gambling machine. But choose your direction wisely from the get-go (value investing for you and me), build a good framework based on good guidance, quality investment books and investing resources, and it’s easy to do well. Ignore all the talking heads using jargon or the people who talk about much money they are raking in. All they want to do is make you feel dumb and gloat about how smart they are. But what if you continue to disbelieve, or you know people who continue to doubt that investing successfully on your own is possible? You don’t need to be a rocket scientist. Investing is not a game where the guy with the 160 IQ beats the guy with 130 IQ. – Warren Buffett If you have more than 120 or 130 I.Q. points, you can afford to give the rest away. You don’t need extraordinary intelligence to succeed as an investor. – Warren Buffett Here are 5 advantages small investors hold over professionals that you must take advantage of. 1. As a Small Investor You Are Able to Choose Your Expertise When you are investing as an individual, you are free to choose whatever specialty you like. You can choose whatever stock to invest in. Large. Small. Biotech. Miners. Safety. Whatever. You can even choose to focus and become an expert in a few industries that excite you or take a broader approach. On the other hand, professionals are paid to focus on certain fields or investing strategies. If you get sick of an industry, just move onto your next interest. Professionals don’t have this luxury of choosing their strengths. As a small investor, you are agile and can go to different market caps, sectors, and even buy some odd lots for a quick turnover. 2. You Can Go Against the Grain Professional investors follow the herd. It’s better to be incorrect with the herd and maintain job security instead of sticking your neck out and getting fired if the investment doesn’t work out. You don’t have a boss obsessed with profits breathing down your neck with another younger guy waiting in line to take your job. You’re free to take a contrarian approach like the good ol’ net net strategy or concentrating on Buffett type stocks. The pros will start investing in an “uncertain” stock, sector or country once it starts to rebound – when the best time to invest has already passed. 3. You Are Not Judged Monthly, Quarterly or Yearly Not being obsessed with beating the market is one of the biggest advantages you have. Because the pros have clients and upper management demanding results, the only thing they can do is chase hot stocks, hot trends and buy and sell quickly so as not to “look” left out. Ignoring short term results and focusing on the big picture will put you in a position to succeed. The once bad Golden State Warriors didn’t win the NBA championship by flipping players every time something didn’t work out. They had a long term team building strategy that paid off in the end. Being able to sacrifice short term results to compound long term wealth is a huge advantage. 4. You Can Afford to Be Patient Can’t find a company to invest in? That’s ok because you can hold cash and wait for the right opportunity. Nobody is going to say anything because you hold 30% of your portfolio in cash. You also put yourself in the best position to succeed by buying depressed securities and playing the waiting game. Professionals on the other hand are risk-averse as they can’t afford to lose their client’s money. This leads to following the herd and mediocre returns. 5. It’s Cheaper You don’t need a room full of computers, computerized trading system software or instant access to information. You don’t have to pay people for insider “tips”. With all the high frequency trading going on, the long term value investing approach saves you money on commissions, taxes and other fees. Take Advantage of Your Advantages There’s no reason to play the same game as the professionals. In Malcolm Gladwell’s book David and Goliath , it covers how the “disadvantaged” overcome the expected winners. An important observation was that if David (the small investor) tries to take on Goliath (Wall Street professionals) within the same set of rules, the winner is always Goliath. However, by not playing by the same system and expectations, David is able to defeat Goliath. In other words, as a small investor, do what the big boys can’t to beat them at their own game. In 2008, Buffett bet that a low cost index fund will outperform a fund of hedge funds. Over a ten-year period commencing on January 1, 2008, and ending on December 31, 2017, the S&P 500 will outperform a portfolio of funds of hedge funds, when performance is measured on a basis net of fees, costs and expenses. The result at the start of 2015? The S&P500 up 63.5% and the hedge fund up around 19.6%. The takeaway? It’s only in the stock market where the average Joe can have such a strong advantage over the professionals. Make the most out of your advantages. Disclosure: I/we have no positions in any stocks mentioned, and no plans to initiate any positions within the next 72 hours. (More…) I wrote this article myself, and it expresses my own opinions. I am not receiving compensation for it. I have no business relationship with any company whose stock is mentioned in this article.