Tag Archives: investing ideas

The Big Lesson From A Bet With Warren Buffett
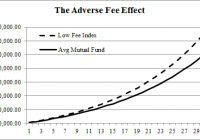
Seven years ago Ted Seides made a bet with Warren Buffett that a fund of hedge funds could outperform the S&P 500 over a ten-year period. As of today, that bet is looking very bad, with the S&P 500 beating the fund of funds by over 40% (63.5% vs. 19.6%). Seides wrote a piece for CFA Institute explaining why the bet has been wrong and some lessons from it. While Seides makes many good points, there’s one lesson that is particularly important in all of this: Seides explains that half of the underperformance is from fees: Just over half (24.4% ÷ 43.9% = 55.6%) of the underperformance by hedge funds can be attributed to fees. A full 19.5% of cumulative underperformance, or approximately 2.6% per annum, must have been caused by something else. That’s not exactly a glowing endorsement for high fee funds. Why would anyone pay more for less? The fact is, the investment world has become dirt cheap. You can get good financial advice for a fraction of the fee that you once had to pay. The entire hedge fund industry is living in the past, hoping to continue to suck 2&20 out of their unwitting clients for as long as they can. The reality is that you don’t have to pay high fees for smart advice any longer. Heck, I offer my asset management service for a measly 0.35% and I’d say I am a pretty “sophisticated” thinker. That’s what my mother tells me anyhow and I believe everything she says. More importantly, we’re entering a world where future returns are likely to be lower in the future. With bonds generating low yields, a balanced portfolio is either going to produce lower returns in the future or higher volatility returns as more of the gain is made up by stocks. This creates a problem for investors. If you’re paying high fees, you’re either paying more for lower risk adjusted returns OR your fees are eating into your returns by an increasingly large margin. If you’re looking at a real return (after inflation) of 6%-7% in stocks, then we have every reason to be mindful of any other frictions like taxes and fees that might reduce that return even further. But what is the average fee effect? To put things in perspective, consider that the average mutual fund charges 0.9% relative to the average low fee index which charges 0.1%. That’s a 0.8% difference. It doesn’t sound like much, but take a 7% compound annual growth rate on $100,000 and extend that over 30 years. Just how much of an impact does it make? The mutual fund ends up with a balance that is 23% lower than the index. In other words, the mutual fund could just mimic the return of the index and reduce your return by $150,000! Either way, the solution is simple. Stop paying high fees. My general rule of thumb is that you should almost never pay more than 0.5% for portfolio management. If you’re paying more than that, then I highly doubt you’re getting your money’s worth. Are you Bullish or Bearish on ? Bullish Bearish Neutral Results for ( ) Thanks for sharing your thoughts. Submit & View Results Skip to results » Share this article with a colleague
IHD: A Tough Sell Based On Performance

Summary IHD invests in emerging markets, which has been a tough market of late. That said, it offers investors a large yield. The problem is the yield is eating away at the CEF’s NAV. The Voya Emerging Markets High Dividend Equity Fund (NYSE: IHD ) is an interesting closed-end fund, or CEF, for those seeking an emerging market play. Essentially, it allows you to add a high-yield investment ( around 11% ) in emerging markets, a key asset allocation basket, to your portfolio. That’s not easy to find. For example, The Vanguard Emerging Markets Stock Index Fund (MUTF: VEIEX ) is yielding around 2.65% based on trailing distributions. But, IHD’s income comes at a cost you may not be willing to pay. What it does IHD’s objective is total return from a mixture of dividends, capital gains, and capital appreciation. It invests, as its name suggests, in emerging market equities. Typically, the portfolio will hold between 60 and 120 securities. On top of that, IHD will sell options on as much as 50% of the portfolio’s value. The options can be on individual stocks but also on indexes and exchange traded funds. Presumably that’s to increase the opportunities for option writing since options on some holdings may not exist or be liquid enough to trade. When looking for stocks, IHD starts with filters based on dividend yield and liquidity to create a universe from which to select individual holdings. It then takes the top-ranked stocks from this list and does fundamental research, evaluating such things as dividend sustainability and growth potential. At the end of the day, IHD is looking to create a portfolio of attractively valued companies with sustainable dividend yields and the potential for growth. The fund’s expenses aren’t outlandish at around 1.4%, according to the Closed-End Fund Association. The fund is, after all, providing active management in areas of the world that are often difficult to invest in, let alone find information about. You probably couldn’t do what they do, even if you wanted to. And that’s before trying to sell options. What about performance So far so good, but… the fund’s performance is middling at best. According to Morningstar, IHD’s trailing three-year annualized net asset value, or NAV, return through January of -1.3% falls at about the 65th percentile of its diversified emerging markets category grouping. Note that Morningstar’s figures include the reinvestment of dividends. The broader category effectively broke even over that span and Vanguard Emerging Market Index Fund posted an annualized gain of roughly 0.75%. So, IHD’s performance is a little below par, but a fat 11% yield might entice you to overlook this fact. That would likely be a mistake here. When IHD came public in early 2011, its NAV was $19.06 a share. The CEF’s NAV fell consistently through February of last year (its fiscal years end in February), bringing the NAV down to $12.50 a share. Sure it paid distributions of around $4 a share over that time, but the NAV decline was precipitous. The NAV is currently around $11.50 a share, which means it’s still going down. You’ll need a rally To be fair, emerging markets haven’t been the most hospitable place to invest in recent years. But this is clearly a case where the large dividend is doing a disservice to shareholders. That’s particularly true if you are using those distributions to live off of. Worse, you’d still be losing money even if you reinvested those distributions. I could go into the fund’s discount (roughly 8%, notably below the fund’s three-year average of about 3%), its country allocations (China is its largest weighting at 20% of assets), sector allocations (finance is around 30% of the portfolio), and individual holdings, but at this point all of that pales in comparison to the distribution’s impact on NAV. Even the chance of the discount closing isn’t particularly enticing in my book compared to the NAV issue. I would avoid IHD unless you think emerging markets are on the verge of a major bull market. That’s the only way you’ll likely see the NAV turn higher. Disclosure: The author has no positions in any stocks mentioned, and no plans to initiate any positions within the next 72 hours. (More…) The author wrote this article themselves, and it expresses their own opinions. The author is not receiving compensation for it (other than from Seeking Alpha). The author has no business relationship with any company whose stock is mentioned in this article.

3-Year Trailing Returns: Momentum And Mean Reversion In Developed Markets

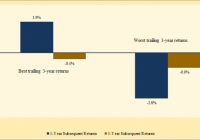
By Baijnath Ramraika, CFA Ben Inker, in GMO’s 4Q 2014 quarterly letter , suggests that there is significant valuation disparity among developed markets with U.S. markets getting a much higher valuation in relation to others. He suggests that given this disparity, it makes more sense to invest in the bad and ugly countries as against the good-looking U.S. In that same letter, Ben shows that it is better to be a contrarian. As evidence, he shows that those developed markets which had the strongest relative performance over the past three years, tend to underperform over the next one- and three-year periods. On the other hand, the worst performing developed markets over the past three years, tend to outperform over the next one- and three-year periods. Wanting to verify, I setup a similar process based on the all-stock developed market indexes that I discussed in one of my earlier articles . The objective was to check the relative investment performance of investing in strongest versus weakest performing developed markets over the past three years. To achieve this, I used country indexes calculated in dollar terms. At the end of every year, I calculated the annualized trailing 3-year return for every country. This return was compared to the average return of all developed market countries to derive relative out(under)performance. Each country was then ranked based on its trailing 3-year relative performance with five best and worst performing countries chosen for further analysis. Figure 1 shows the average 1-year and 3-year subsequent annualized excess returns for the best and worst five countries. It is important to note that the time frame of this study is 1995 to 2014. With three years of past performance as the selection criteria, the study begins at end of the year 1997. Figure 1 (click to enlarge) Trailing 3-year performance as a predictor for forward returns Clearly, my numbers are not in sync with what Ben Inker found in his analysis. There are several possible reasons for this difference. For one, the time period of my study may be different than the time period used by Ben. Secondly, while my study utilizes all stock indices, it is possible that indices used by Ben are somewhat narrower in representation. Keeping the different result aside, what Figure 1 suggests is that there is some momentum persistence, at least in the near term. The best performing five countries continued to outperform over the next year while the worst performing five countries continued to underperform over the next year. However, as is evident by the difference between 1-year and 3-year subsequent annualized returns, there seems to be some mean reversion taking place in year 2 and 3. Figure 2 shows this mean reversion. Figure 2 (click to enlarge) Mean reversion takes hold in the second and third year As is seen, countries with the best 3-year trailing performance experience negative relative performance in the second and the third year, i.e., momentum persists over the one-year period with mean reversion taking over after that. In summary, both momentum and mean reversion have an effect on subsequent investment returns. However, their effects are felt in different time frames.