Predicting The Future Is Difficult
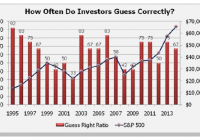
Neils Bohr, a Nobel prize-winning Danish physicist who made foundational contributions to the understanding of atomic structure and quantum theory, is credited to have once said: “Prediction is very difficult, especially if it’s about the future.” While it sounds more like a ” Yogi-ism ,” the point made is interesting particularly as it relates to investing. I was reminded of this quote by a comment made on a recent post entitled “Bullish Or Bearish, What The Charts Say.” As I stated in that post: “I really don’t care much for the “bull/bear” debate that ensues on a daily basis as both camps are eventually wrong. When investing in the markets ‘it is, what it is’ and it is of very little use that some pundit or analyst was ‘right’ during the bull market if they never saw the bear market coming. The opposite is also true.” Predictions of the future are indeed very difficult, and yet individuals are challenged every day with doing precisely that. For traders, it is what the market, or a particular investment, will do in the next few minutes to days. For longer-term investors, those predictions move out to months or years. The problem is that humans generally suck at predicting the future, particularly when it comes to investing. This is clearly shown in Dalbar’s 2015 investor study in what they term the ” Guess Right Ratio .” To wit: “DALBAR continues to analyze the investor’s market timing successes and failures through their purchases and sales. This form of analysis, known as the Guess Right Ratio , examines fund inflows and outflows to determine how often investors correctly anticipate the direction of the market. Investors guess right when a net inflow is followed by a market gain, or a net outflow is followed by a decline. Unfortunately for the average mutual fund investor, they gained nothing from their prognostications. ” (click to enlarge) The inability of investors to correctly predict the future has had serious consequences for their portfolio both in the short and long term as shown by the two tables below. (click to enlarge) (click to enlarge) The massive underperformance over a 30-year span shows that investors, despite the best of intentions of being ” long term ” are saddled not only by poor predictions of the future, but also the ” emotional biases ” that drive accumulations and liquidations at the most inopportune times more commonly known as the “buy high/sell low” syndrome. Currently, it is ” predicted ” that the market will only rise from current levels as witnessed by a recent report from Brian Wesbury at First Trust: “Using a 4% 10-year discount rate gives us a ‘fair value’ calculation of 2,550 and it would take a 10-year yield north of 4.8% and no growth in corporate profits in Q2 for the model to suggest equities are fully valued.. .investors should be more tilted toward equities than they would normally be and we believe those that are should continue to enjoy attractive returns over at least the next couple of years. This bull has further to run .” However, Brian, like all humans, including me, are horrible predictors of future outcomes. As an example, this is what Brian predicted in July 2007 just before the largest financial crash since the ” Great Depression :” “The bottom line is that fears about the underlying health of the economy and financial markets are more about hypochondria than reality. The Fed is not tight, just less loose, the economy is strong, tax rates are low, and corporate earnings remain robust. Let’s not confuse indigestion and heartburn with the ‘big one. ‘” Or this in February of 2008 as the recession was in full swing: “None of this is an attempt to say that a recession is impossible. Recessions are always possible. But neither the policy pre-conditions, nor the data, suggest we are anywhere near a recession today. Current fears of a recession are premature .” Of course, it did turn out to be the “big one.” However, Brian, like all economists and analysts are using data to make future predictions that are highly subject to revisions in the future. This is the equivalent of trying to shoot a moving target while blindfolded riding a merry-go-round. While I am sure there is some trick shot artist that could nail such a feat on “America’s Got Talent,” for the mere mortal the odds of success are extremely low. The same problem that exists for individuals, also applies to ” professionals .” There are but a handful of investment managers that have consistently outperformed the ” market ” over long periods of time. But even that comment is a bit misleading as relative outperformance is of little consolation to investors when the market is down 30%, and the portfolio is down 29%. Did the manager outperform? Yes. Did the investor stick around? Probably not. But it is precisely this conversation that leads to a litany of articles promoting ” buy and hold ” investing. While ” buy and hold ” investing will indeed work over extremely long periods, investor success is primarily a function of time frames and valuation at the beginning of the period. Considering that most investors have about a 20-year time horizon until they reach retirement, the “when” becomes a critical component of future success. (click to enlarge) Of course, ” buy and hold ” commentary is mostly seen near fully mature “bull markets” as the previous bear market fades into distant memory. Eventually, despite the best of intentions, the markets will complete their full-market cycle and investors will head for the exits perpetuating the ” buy high/sell low ” syndrome. It is here that we find the VERY BEST predictor of future outcomes – past behavior. Psychology Today had a very interesting piece on this particular issue as it relates to violent crimes. But when it comes to investing, most individuals fit the requirements necessary to fulfill how they will behave in the future. Habitual behavior – (buy high/sell low) Short time intervals – (months or years, not decades) Anticipated situation aligns with the past situation that activated behavior. (bull vs. bear market) Behavior not extinguished by negative impact. (loss not great enough to deter future action) Person remains essentially unchanged. (speculator vs. saver) Person is fairly consistent (willingness to accept risk/avoid loss) Certainly, past behavior may not accurately predict the future behavior of a single individual. However, when it comes to the financial markets which is representative of the ” herd mentality ,” past behaviors are likely good indicators of future outcomes. Despite an ongoing litany of bullishly biased reports as markets push towards new highs, it should be remembered that markets only attain new highs about 5% of the time historically speaking. The other 95% of the time is recouping previous losses. (click to enlarge) Does this mean that you should sell everything and go to “cash?” Of course not. However, it does mean that as an investor you should critically analyze your past personal behavior during market advances AND declines. If you are like MOST investors , it is likely that you did exactly the opposite of what you should have. If that is the case, does it not make some sense to begin thinking about doing something different?