Tag Archives: investing ideas

Backtesting – A Cautionary Example

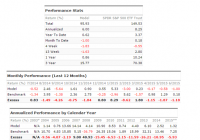
Independent research, long/short equity, dividend investing, ETF investing “}); $$(‘#article_top_info .info_content div’)[0].insert({bottom: $(‘mover’)}); } $(‘article_top_info’).addClassName(test_version); } SeekingAlpha.Initializer.onDOMLoad(function(){ setEvents();}); My previous article detailed backtest results for the ETFReplay.com portfolio. Aggregate, risk-adjusted results since 2004 were impressive when compared to a 60/40 Vanguard mutual fund. However, results over the past 2-3 years lagged the benchmark. The test below was conducted using Portfolio123 (“P123″). It uses a similar ranking system to the ETFReplay 6/3/3 system but has a few seemingly “minor” differences: The P123 begins with a similar basket of ETFs, the only difference is the P123 system ranks 15 ETFs instead of 14, with the PowerShares DB Agriculture ETF (NYSEARCA: DBA ) as the extra ETF. The starting date for the P123 test is 12/10/03, which differs from the ETFReplay start date of 1/1/2004. The P123 system rebalances every 4 weeks, instead of at the end of each month. The ETFReplay test assumes equal holdings each month (i.e. rebalancing back to equal weight each month at no cost) while P123 lets positions run so holdings may become unbalanced over time. The P123 test uses the next days closing price of each ETF for the transaction price, compared to the ETFReplay system which uses the same days closing price when each ETF is ranked. Finally, and perhaps most importantly, the P123 test accounts for slippage with each transaction, which reduces returns. The slippage for each transaction is calculated based on the average trading volume for each ETF. This is a conservative method for calculating ETF slippage. After accounting for these differences, we see the P123 test shows significantly lower results (as an aside, the benchmark for this test was the SPDR S&P 500 Trust ETF ( SPY)): Tables and charts courtesy of Portfolio123 (click to enlarge) (click to enlarge) However, if we assume zero slippage results improve dramatically. Total and annualized return are significantly higher yet we still see different returns and risk metrics than the ETFReplay test. This can be attributed to a slightly different pool of ETFs, and different rebalancing dates/methodology: (click to enlarge) (click to enlarge) The point of this exercise is not to disparage backtests or historical results. Rather, it shows the importance of considering trading costs as well as how changes in test parameters can impact results. Focus on making your tests robust. Run them through multiple time frames with different assumptions and be mindful of data-mining. Finally, be conscious of trading costs and fees! Many brokers now offer commission free ETFs, but taxes and trading slippage can take a big bite out of returns. Disclosures: None Share this article with a colleague

How To Select Securities

In earlier steps, you should have defined top level asset classes that have a lack of correlation to one another and a timeless strategy. Then, you should have selected underlying sectors that strategically boost returns and take advantage of leading indicators. Lastly, you determined a system to categorize future holdings to implement your investment strategy . The next step is to select specific securities you will purchase to implement this strategy. We call this list of securities our “Buy List,” because it is what we would ideally purchase if a client came to us all in cash. We regularly review our Buy List as we are always looking for even better securities to implement our investment strategy. We use three criteria to judge securities. First, the investment should be diversified within its sector. Diversification is the means of achieving a rebalancing bonus , a boost in returns and decrease in volatility due to moving between low correlation stocks. This bonus is highest when the correlation is lowest, but even correlated assets which often move in sync over the long run experience different volatility and returns over any given year. For this reason, your Buy List investment selections should be as diversified as possible within the targeted sector. Such diversification is not easily achieved with individual company stocks. To use U.S. large cap stocks as an example, you would need over 60 individual stocks to achieve only 86% of the diversification . Diversification via individual stocks is even more difficult for small and mid-cap stocks and impossible to accomplish for foreign stock categories using US stock exchanges. For this reason, your buy list should be funds – exchange traded funds (ETFs) or mutual funds – rather than individual securities. There are two methods of seeing how well diversified a fund is within its category. First, favor funds with a large number of holdings. There is no such thing as “over-diversification.” A fund with 200 small cap value stocks is better diversified than one with only 75. Second, favor funds where the top ten holdings represent a smaller percentage of the fund. A small cap value fund whose top ten holdings represent 75% of the fund is less diversified than one where the top ten holdings only represents 25% of the fund. Second, the expense ratio should be low. The most important selection criterion is expense ratio. Morningstar did a study to see what was a better indicator of a fund having better returns in the future: having a low expense ratio or having more Morningstar stars. They determined that having a low expense ratio was a better indicator than Morningstar stars . Low expense ratios help you earn more when markets go up and lose less when they go down. Over time, this can significantly affect the value of your portfolio. The return of an index fund is simply the return of the index plus or minus tracking error minus fund expenses. This is why having a low expense ratio gives you the best chance of having higher returns. Currently the average asset weighted expense ratio for a stock mutual fund is 0.74%. This cost has been dropping over the past decade as funds have to lower costs in order to compete for market share. In most cases, a good investment advisor can significantly reduce the cost of the funds used to diversify your portfolio. We regularly build portfolios with low expense ratios, and many of the revisions we make to our Buy List are moving towards lower cost funds. Our online gone fishing portfolio has an expense ratio of just 0.32% . Finally, we look for low trading costs. Trading costs, like expense ratios, can hurt returns. While expense ratios hurt fund returns, trading costs hurt the rebalancing bonus by putting a drag on moving in and out of investments. Trading costs are tied to your custodian. For this reason, selection of your custodian is extremely important to your investment philosophy. At Schwab, there are four different types of investments, each with their own type of trading cost. Most stock and ETF trades are made at Schwab’s $8.95 per trade brokerage fee. There are some ETFs on the Schwab platform for which they wave the brokerage fee and allow you to trade them for no cost. This can be deceptive. Some of the no-transaction fee ETFs are Schwab funds with higher expense ratios or larger trading spreads either of which could be more costly than a trading fee. For mutual funds, there is a fee between $25 and $50 depending on how much is being traded and how you have negotiated fees for your clients. Although you should hunt for low trading costs, you should also change your purchasing habits based upon the cost. First, because of compound interest, larger amounts of money can overcome a small trading cost faster than smaller amounts of money. So, if you have a trading cost, assess the how long different initial investments takes to earn back the fee. We do this by measuring the trading cost as a percentage of the purchase amount. If you are purchasing $30,000 of an investment, a $30 trading fee is only 0.1%, which could be earned back in a week. However, if you are only investing $600 in the same investment, the same trading fee would be 5% of your investment, which may take 1 year to earn back. Second, we use a simple technique we call “Rocks and Sand” to keep total expenses low without losing the flexibility of diversifying and rebalancing. Rocks are higher trading cost but lower expense ratio investments. They have a fee when you purchase them as well as a fee when you break them apart but they are cheaper to hold once you have purchased them because of their lower expense ratio. Meanwhile, sand has a lower trading cost but a higher expense ratio. Sand is easy to move from one investment to another but is not ideal for long-term holding. Our transaction fee ETFs or mutual funds are Rocks while no-transaction-fee funds are Sand. We fill each asset class with Rocks. Then when smaller monthly deposits come in, we fill in the asset class with Sand around the Rocks. When a significant amount of Sand collects in an asset class, we sell the sand to purchase a Rock in its place. In this manner, you can identify ideal securities for your Buy List as well as trade them efficiently. Although it is not easily appraised, we believe a curated list of funds is extremely valuable. Our investment committee meets regularly to reevaluate and adjust our Buy List. Even if all you use to select funds is expense ratio, the value might be as high as 0.42%. We can only imagine the value of fund selection also based on strategic fit, diversification, index followed, and trading costs. Your investment strategy is critically important but the implementation requires wise fund selection.
Why Do Individual Investors Underperform?

Bonds, dividend investing, ETF investing, currencies “}); $$(‘#article_top_info .info_content div’)[0].insert({bottom: $(‘mover’)}); } $(‘article_top_info’).addClassName(test_version); } SeekingAlpha.Initializer.onDOMLoad(function(){ setEvents();}); Barry Ritholtz posted a good video discussing whether mutual fund managers are skilled or not. I am not going to discuss the points made in that video, however, it did get me thinking about something. I have found that most mutual funds are closet index funds. That is, the vast majority of mutual funds are not engaged in any sort of strategic asset allocation that differentiates them sufficiently from highly correlated index funds. So, your average XYZ Large Cap fund will tend to have a 85%+ correlation to the S&P 500, but it will charge a much higher fee. Over time this will degrade performance since the mutual fund is basically picking 100-200 stocks inside of a highly correlated 500 stock index and charging you a recurring high fee over time. Vangaurd has shown on multuple occasions that it’s fees, not asset picking skill, that drives underperformance. But what’s interesting about these mutual funds is that even though they can’t beat their index they do tend to beat the average individual investor. This has been well documented in research pieces ( such as this one ), but we also know it’s true thanks to investor surveys like the AAII asset allocation survey. Over the last 30 years AAII has maintained a record of individual investor asset allocations and over this period the average allocation has been: Stock/Stock Funds: 60% Bonds/Bond Funds: 16% Cash: 24% What stands out there is the cash position. Of course, “cash” is a bit of a misnomer in a brokerage account because “cash” is usually just T-Bills. The kicker is, cash (or short-term bonds) has been a big drag on performance over the last 30 years. The AAII investor with an average 24% cash position generated just a 8.4% annualized return relative to a 9.1% return for the average investor who invested that 24% in a bond aggregate (your standard 60/40). And keep in mind that this is before accounting for all the inefficiencies documented in the aforementioned research. The interesting point here is that most professional money managers don’t hold a lot of cash at all times. The latest data from ICI showed that the average equity fund had just 3.5% cash. Since bonds and stocks just about always beat cash over a 30 year period we know that the average individual investor with a 24% cash position MUST, by definition, do worse than even the closet indexing professionals. This doesn’t mean the closet indexers are “skilled”. It just means they benefit from being in the game more. Basically, you can’t score if you aren’t even on the field and while closet indexing mutual funds are worse at scoring than their benchmark, they score more often than individuals because the individuals spend too much time out of the game. So, the question is, why do individual investors tend to hold so much cash? I have a few guesses: Individuals are inherently short-term in their thinking because they know, intuitively, that their financial lives are a series of short-terms inside of a long-term. This short-term perspective is a totally rational reaction to uncertain financial markets. A high cash balance provides the ultimate sense of certainty. This is a silly perspective, however, because informed market participants know that financial asset market returns tend to become more predictable over longer periods of time. This does not mean, however, that we should necessarily apply the textbook idea of the “long-term” to our portfolios as this isn’t always consistent with our actual financial lives. This short-term thinking leads most investors to churn their accounts, pay high fees and pay high taxes. Again, it’s an attempt to create certainty in an inherently uncertain financial world. But the attempt to take control in the short-term generally results in lots of detrimental activity that hurts performance. I tend to be prefer a cyclical timeframe because it captures the best of both worlds – it can be tax and fee efficient without taking the irrational textbook “long-term” perspective. This raises a more interesting question. Can this behavior be fixed? I’m not so certain. In a world where we’re prone to thinking in the short-term the idea of “long-term” and even medium term investing is very difficult for most people to maintain. But what it does show is that more investors need to be aware of their behavioral biases and understand the basic arithmetic of asset allocation . You might not become a global macro asset allocation expert, but you can avoid making many of the short-term mistakes that lead to this disparity in performance. Sources: Share this article with a colleague