Tag Archives: investing ideas

Best And Worst: Small Cap Growth ETFs, Mutual Funds And Key Holdings
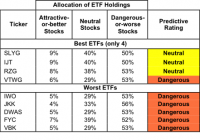
Summary Small Cap Growth style ranks 10th in 2Q15. Based on an aggregation of ratings of 11 ETFs and 498 mutual funds. SLYG is our top rated Small Cap Growth ETF and VSCRX is our top rated Small Cap Growth mutual fund. The Small Cap Growth style ranks 10th out of the 12 fund styles as detailed in our 2Q15 Style Rankings report . It gets our Dangerous rating, which is based on an aggregation of ratings of 11 ETFs and 498 mutual funds in the Small Cap Growth style. Figures 1 and 2 show the five best and worst rated ETFs and mutual funds in the style. Not all Small Cap Growth style ETFs and mutual funds are created the same. The number of holdings varies widely (from 29 to 1214). This variation creates drastically different investment implications and, therefore, ratings. Investors seeking exposure to the Small Cap Growth style should buy one of the Attractive-or-better rated ETFs or mutual funds from Figures 1 and 2. Figure 1: ETFs with the Best & Worst Ratings – Top 5 (click to enlarge) * Best ETFs exclude ETFs with TNAs less than $100 million for inadequate liquidity. PowerShares Fundamental Pure Small Growth Portfolio ETF (NYSEARCA: PXSG ) and Vanguard S&P Small Cap 600 Growth (NYSEARCA: VIOG ) are excluded from Figure 1 because their total net assets are below $100 million and do not meet our liquidity minimums. Figure 2: Mutual Funds with the Best & Worst Ratings – Top 5 (click to enlarge) * Best mutual funds exclude funds with TNAs less than $100 million for inadequate liquidity. Transparent Value Small Cap Fund ( TVSIX , TVSFX ) and Oak Associates River Oak Discovery Fund (MUTF: RIVSX ) are excluded from Figure 2 because their total net assets are below $100 million and do not meet our liquidity minimums. State Street SPDR S&P 600 Small Cap Growth (NYSEARCA: SLYG ) is our top-rated Small Cap Growth ETF and Virtus Small-Cap Core Fund (MUTF: VSCRX ) is our top-rated Small Cap Growth mutual fund. SLYG earns a Neutral rating and VSCRX earns an Attractive rating. One of our favorite stocks held by Small Cap funds is Universal Insurance Holdings (NYSE: UVE ), which earns a Very Attractive rating. Since 2009, Universal Insurance has grown after-tax profit ( NOPAT ) by 21% compounded annually. In addition to its NOPAT growth, the company has increased its return on invested capital ( ROIC ) to 39% in 2014, up from 16% in 2011. Economic earnings have also been positive since 2007. Despite the impressive profit growth achieved by Universal Insurance, the stock remains undervalued. At its current price of $24/share, UVE has a price to economic book value ( PEBV ) ratio of 0.9. This ratio implies the market expects Universal Insurance’s NOPAT to decline by 10% from current levels. However, as noted above, Universal has grown NOPAT by double digits over the past five years. If Universal Insurance Holdings can grow NOPAT by just 8% compounded annually for the next 10 years the stock is worth $38/share today – a 58% upside. Vanguard Small-Cap Growth ETF (NYSEARCA: VBK ) is our worst rated Small Cap Growth ETF and AllianzGI Ultra Micro Cap Fund (MUTF: GUCAX ) is our worst rated Small Cap Growth mutual fund. VBK earns a Dangerous rating and GUCAX earns a Very Dangerous rating. One of our worst rated stocks held by GUCAX is Cardiovascular Systems (NASDAQ: CSII ), which earns our Dangerous rating. NOPAT losses have increased every year since 2012, expanding from -$14 million to over -$33 million in 2014. ROIC has also been negative each year since 2012 and is currently -32%. This equates to Cardiovascular Systems destroying 32 cents of every dollar invested into the business. Despite all of this, CSII’s stock price does not reflect the company’s deteriorating performance. Since 2012, the stock has tripled in price. When considering the fundamental performance of the company over this period, we believe the stock to be overvalued. To justify its current price of $29/share, the company would need to achieve positive pretax margins immediately and grow revenue by 35% compounded annually for the next 18 years . This seems very optimistic given that the company has never grown revenue above 31% year over year, and has remained unprofitable while doing so. Figures 3 and 4 show the rating landscape of all Small Cap Growth ETFs and mutual funds. Figure 3: Separating the Best ETFs From the Worst ETFs (click to enlarge) Figure 4: Separating the Best Mutual Funds From the Worst Funds (click to enlarge) Sources Figures 1-4: New Constructs, LLC and company filings Disclosure: David Trainer and Allen L. Jackson receive no compensation to write about any specific stock, style, style or theme. Disclosure: I/we have no positions in any stocks mentioned, and no plans to initiate any positions within the next 72 hours. (More…) I wrote this article myself, and it expresses my own opinions. I am not receiving compensation for it. I have no business relationship with any company whose stock is mentioned in this article.
NiSource Is Overvalued And Speculative

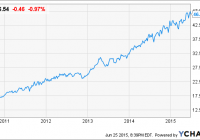
Summary NI is not suitable for either the Defensive Investor or the Enterprising Investor following the ModernGraham approach. According to the ModernGraham valuation model, the company is overvalued at the present time. The market is implying a 10.15% earnings growth over the next 7-10 years, considerably more than the rate the company has seen in recent years. Utilities often attract investors due to consistent earnings and dividend payments, and NiSource (NYSE: NI ) is no exception. Several qualitative factors make the company interesting to numerous investors. For example, Seeking Alpha contributor Josh Young recently wrote that the company’s spin off of its pipeline business makes it potentially a good value, a view that The Socially Responsible Investor also holds . Both of these articles provide great qualitative issues to consider, but one must first look at a quantitative analysis of the company. In fact, Benjamin Graham, the father of value investing, taught that the most important aspect to consider is whether the company is trading at a discount relative to its intrinsic value. It is through a thorough fundamental analysis that the investor is able to determine a potential investment’s merits. Here’s an updated look at how the company fares in the ModernGraham valuation model. This model is inspired by the teachings of Benjamin Graham and considers numerous metrics intended to help the investor reduce risk levels. The first part of the analysis is to determine whether the company is suitable for the very conservative Defensive Investor or the less conservative Enterprising Investor who is willing to spend a greater amount of time conducting further research. In addition, Graham strongly suggested that investors avoid speculation in order to remove the subjective elements of emotion. This is best achieved by utilizing a systematic approach to analysis that will provide investors with a sense of how a specific company compares to another. By using the ModernGraham method , one can review a company’s historical accomplishments and determine an intrinsic value that can be compared across industries. NI data by YCharts Defensive Investor – Must pass at least 6 of the following 7 tests: Score = 5/7 Adequate Size of Enterprise – Market capitalization of at least $2 billion – PASS Sufficiently Strong Financial Condition – Current ratio greater than 2 – FAIL Earnings Stability – Positive earnings per share for at least 10 straight years – PASS Dividend Record – Has paid a dividend for at least 10 straight years – PASS Earnings Growth – Earnings per share has increased by at least one-third over the last 10 years, using three-year averages at the beginning and end of the period – PASS Moderate PEmg (price over normalized earnings) ratio – PEmg is less than 20 – FAIL Moderate Price to Assets – PB ratio is less than 2.5 or PB x PEmg is less than 50 – PASS Enterprising Investor – Must pass at least 4 of the following 5 tests tobe suitable for a Defensive Investor: Score = 3/5 Sufficiently Strong Financial Condition, Part 1 – Current ratio greater than 1.5 – FAIL Sufficiently Strong Financial Condition, Part 2 – Debt-to-Net Current Assets ratio less than 1.1 – FAIL Earnings Stability – Positive earnings per share for at least 5 years – PASS Dividend Record – Currently pays a dividend – PASS Earnings Growth – EPSmg greater than that 5 years ago – PASS Valuation Summary Key Data Recent Price $46.54 MG Value $40.93 MG Opinion Overvalued Value Based on 3% Growth $23.43 Value Based on 0% Growth $13.74 Market Implied Growth Rate 10.15% Net Current Asset Value (NCAV) -$50.77 PEmg 28.80 Current Ratio 0.82 PB Ratio 2.26 Balance Sheet – March 2015 Current Assets $2,261,000,000 Current Liabilities $2,758,000,000 Total Debt $7,958,000,000 Total Assets $24,899,000,000 Intangible Assets $3,928,000,000 Total Liabilities $18,375,000,000 Outstanding Shares 317,400,000 Earnings Per Share 2015 (estimate) $1.73 2014 $1.67 2013 $1.70 2012 $1.39 2011 $1.03 2010 $1.01 2009 $0.84 2008 $1.34 2007 $1.14 2006 $1.14 2005 $1.04 Earnings Per Share – ModernGraham 2015 (estimate) $1.62 2014 $1.49 2013 $1.33 2012 $1.14 2011 $1.04 2010 $1.06 Dividend History NI Dividend data by YCharts Conclusion NiSource does not qualify for the Enterprising Investor or the more conservative Defensive Investor. The Defensive Investor is concerned by the low current ratio along with the high PEmg ratio, while the Enterprising Investor is only concerned with the level of debt relative to the current assets. Therefore, all value investors should only proceed with the next stage of the analysis, which is a determination of an estimate of intrinsic value, with a speculative attitude in mind. From a valuation side of things, the company has grown its EPSmg (normalized earnings) from $1.04 in 2011 to only an estimated $1.62 for 2015. This level of demonstrated growth does not support the market’s implied estimate for earnings growth of 10.15% over the next 7-10 years. The company’s recent earnings history shows an average annual growth in EPSmg of around 11.22%; however, the ModernGraham valuation model reduces such a rate to a more conservative figure, assuming some slowdown will occur. As a result, the model returns an estimate of intrinsic value falling within below the current price, indicating NiSource is overvalued at the present time. Disclosure: I/we have no positions in any stocks mentioned, and no plans to initiate any positions within the next 72 hours. (More…) I wrote this article myself, and it expresses my own opinions. I am not receiving compensation for it (other than from Seeking Alpha). I have no business relationship with any company whose stock is mentioned in this article.

3 Healthcare Funds To Buy As Supreme Court Upholds ObamaCare

Fund holdings, ETF investing “}); $$(‘#article_top_info .info_content div’)[0].insert({bottom: $(‘mover’)}); } $(‘article_top_info’).addClassName(test_version); } SeekingAlpha.Initializer.onDOMLoad(function(){ setEvents();}); The Supreme Court has ruled 6-3 to uphold a key provision of the Affordable Care Act. The Supreme Court ruling holds that the Affordable Care Act can authorize federal tax credits for eligible Americans living not just in states with their own exchanges but also in the states that use the federal market place. This decision is not only a major win for the Obama Administration, it is also a win for healthcare companies. After the announcement, the S&P 500 healthcare index rose .85 percent and many hospital stocks enjoyed gains of 8 percent and above. These reactions from the market, show that Wall Street views the Supreme Court decision as a positive sign for the continuance of strong growth in the healthcare sector. With this Supreme Court decision and the historical steadiness of the healthcare sector, it would be wise to consider investing in this sector or increasing your investment exposure. Below we will share with you 3 buy-ranked healthcare mutual funds. Each has earned either a Zacks Mutual Fund Rank #1 (Strong Buy) or a Zacks Mutual Fund Rank #2 (Buy) as we expect these mutual funds to outperform their peers in the future. Fidelity Select Medical Delivery Portfolio (MUTF: FSHCX ) seeks long-term capital growth. FSHCX invests a major portion of its assets mainly involved in operations related to hospitals, nursing homes and other organizations engaged in providing healthcare services. FSHCX primarily focuses on acquiring common stocks of companies throughout the globe. Factors including financial strength and economic conditions are considered to invest in a company. The Fidelity Select Medical Delivery Portfolio fund is non-diversified and has returned 17.1% in the year-to-date frame. FSHCX has an expense ratio of 0.79% as compared to a category average of 1.37%. Turner Medical Sciences Long/Short C (MUTF: TMSCX ) invests a large chunk of its assets in healthcare firms. TMSCX uses a long/short growth strategy for reduction of volatility and capital preservation during market downturns. TMSCX mainly focuses on acquiring securities of companies having market capitalizations greater than $250 million. TMSCX is expected to maintain a portfolio of 15 to 75 securities long, and 15 to 75 securities short. The Turner Medical Sciences Long/Short C fund has returned 27.6% in the year-to-date frame. As of May 2015, TMSCX held 40 issues with 4.96% of its assets invested in Prothena Corp. pls (NASDAQ: PRTA ). Janus Global Life Sciences D (MUTF: JNGLX ) seeks capital appreciation over the long run. JNGLX invests the lion’s share of its assets in securities of life science oriented companies. JNGLX invests a minimum of one-fourth of its assets in firms from the “life sciences” domain. The Janus Global Life Sciences D fund has returned 21.8% in the year-to-date frame. Andrew Acker is the fund manager and has managed JNGLX since 2007. Original Post Share this article with a colleague