Scalper1 News
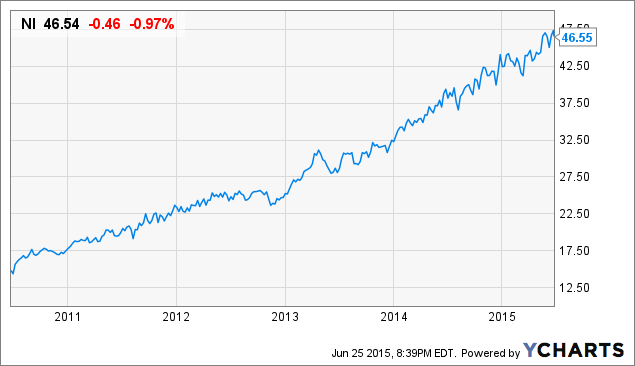
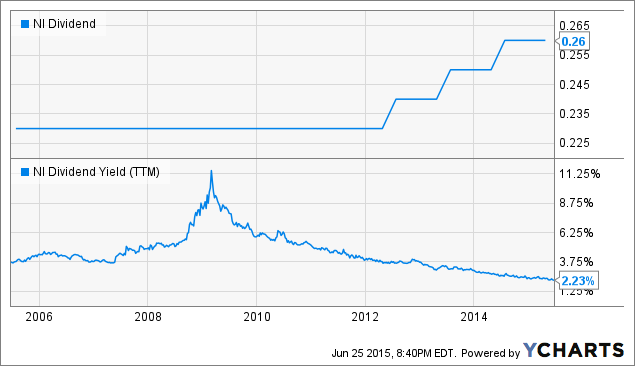 Summary NI is not suitable for either the Defensive Investor or the Enterprising Investor following the ModernGraham approach. According to the ModernGraham valuation model, the company is overvalued at the present time. The market is implying a 10.15% earnings growth over the next 7-10 years, considerably more than the rate the company has seen in recent years. Utilities often attract investors due to consistent earnings and dividend payments, and NiSource (NYSE: NI ) is no exception. Several qualitative factors make the company interesting to numerous investors. For example, Seeking Alpha contributor Josh Young recently wrote that the company’s spin off of its pipeline business makes it potentially a good value, a view that The Socially Responsible Investor also holds . Both of these articles provide great qualitative issues to consider, but one must first look at a quantitative analysis of the company. In fact, Benjamin Graham, the father of value investing, taught that the most important aspect to consider is whether the company is trading at a discount relative to its intrinsic value. It is through a thorough fundamental analysis that the investor is able to determine a potential investment’s merits. Here’s an updated look at how the company fares in the ModernGraham valuation model. This model is inspired by the teachings of Benjamin Graham and considers numerous metrics intended to help the investor reduce risk levels. The first part of the analysis is to determine whether the company is suitable for the very conservative Defensive Investor or the less conservative Enterprising Investor who is willing to spend a greater amount of time conducting further research. In addition, Graham strongly suggested that investors avoid speculation in order to remove the subjective elements of emotion. This is best achieved by utilizing a systematic approach to analysis that will provide investors with a sense of how a specific company compares to another. By using the ModernGraham method , one can review a company’s historical accomplishments and determine an intrinsic value that can be compared across industries. NI data by YCharts Defensive Investor – Must pass at least 6 of the following 7 tests: Score = 5/7 Adequate Size of Enterprise – Market capitalization of at least $2 billion – PASS Sufficiently Strong Financial Condition – Current ratio greater than 2 – FAIL Earnings Stability – Positive earnings per share for at least 10 straight years – PASS Dividend Record – Has paid a dividend for at least 10 straight years – PASS Earnings Growth – Earnings per share has increased by at least one-third over the last 10 years, using three-year averages at the beginning and end of the period – PASS Moderate PEmg (price over normalized earnings) ratio – PEmg is less than 20 – FAIL Moderate Price to Assets – PB ratio is less than 2.5 or PB x PEmg is less than 50 – PASS Enterprising Investor – Must pass at least 4 of the following 5 tests tobe suitable for a Defensive Investor: Score = 3/5 Sufficiently Strong Financial Condition, Part 1 – Current ratio greater than 1.5 – FAIL Sufficiently Strong Financial Condition, Part 2 – Debt-to-Net Current Assets ratio less than 1.1 – FAIL Earnings Stability – Positive earnings per share for at least 5 years – PASS Dividend Record – Currently pays a dividend – PASS Earnings Growth – EPSmg greater than that 5 years ago – PASS Valuation Summary Key Data Recent Price $46.54 MG Value $40.93 MG Opinion Overvalued Value Based on 3% Growth $23.43 Value Based on 0% Growth $13.74 Market Implied Growth Rate 10.15% Net Current Asset Value (NCAV) -$50.77 PEmg 28.80 Current Ratio 0.82 PB Ratio 2.26 Balance Sheet – March 2015 Current Assets $2,261,000,000 Current Liabilities $2,758,000,000 Total Debt $7,958,000,000 Total Assets $24,899,000,000 Intangible Assets $3,928,000,000 Total Liabilities $18,375,000,000 Outstanding Shares 317,400,000 Earnings Per Share 2015 (estimate) $1.73 2014 $1.67 2013 $1.70 2012 $1.39 2011 $1.03 2010 $1.01 2009 $0.84 2008 $1.34 2007 $1.14 2006 $1.14 2005 $1.04 Earnings Per Share – ModernGraham 2015 (estimate) $1.62 2014 $1.49 2013 $1.33 2012 $1.14 2011 $1.04 2010 $1.06 Dividend History NI Dividend data by YCharts Conclusion NiSource does not qualify for the Enterprising Investor or the more conservative Defensive Investor. The Defensive Investor is concerned by the low current ratio along with the high PEmg ratio, while the Enterprising Investor is only concerned with the level of debt relative to the current assets. Therefore, all value investors should only proceed with the next stage of the analysis, which is a determination of an estimate of intrinsic value, with a speculative attitude in mind. From a valuation side of things, the company has grown its EPSmg (normalized earnings) from $1.04 in 2011 to only an estimated $1.62 for 2015. This level of demonstrated growth does not support the market’s implied estimate for earnings growth of 10.15% over the next 7-10 years. The company’s recent earnings history shows an average annual growth in EPSmg of around 11.22%; however, the ModernGraham valuation model reduces such a rate to a more conservative figure, assuming some slowdown will occur. As a result, the model returns an estimate of intrinsic value falling within below the current price, indicating NiSource is overvalued at the present time. Disclosure: I/we have no positions in any stocks mentioned, and no plans to initiate any positions within the next 72 hours. (More…) I wrote this article myself, and it expresses my own opinions. I am not receiving compensation for it (other than from Seeking Alpha). I have no business relationship with any company whose stock is mentioned in this article. Scalper1 News
Scalper1 News