Tag Archives: investing ideas

PRIDX: A Good Way To Invest In High-Quality Small Caps

Summary A recent research study found that higher-quality smaller companies have outperformed higher-quality larger companies. PRIDX has generally outperformed its global small/mid cap benchmark. PRIDX has been experiencing fund inflows and strong relative strength. Overall Objective and Strategy The primary objective of the T. Rowe Price International Discovery Fund (MUTF: PRIDX ) is long term growth of capital through investments in common stocks of rapidly growing, small to medium-sized companies outside the U.S. They look for high-quality growth stocks that can compound returns beyond the typical one- or two-year time horizons of most investors. Smaller companies throughout the world can react relatively quickly to changes in the marketplace and the economy, which may give them an edge to capitalize on investment opportunities faster than their larger counterparts. The fund has a fairly high risk profile because of its investments in small caps and some less-developed countries. Aside from market risk, there are also risks associated with unfavorable currency exchange rates and political or economic uncertainty abroad. Fund Expenses PRIDX is a no-load fund. The expense ratio for PRIDX is 1.21% which is higher than I like, but not bad compared to other actively managed international small/mid cap funds. Minimum Investment PRIDX has a minimum initial investment of $2,500 in a taxable account, and $1,000 for a group IRA. Past Performance PRIDX is classified by Morningstar in the “Foreign Small/Mid Growth” or FR category. Compared with other mutual funds in this category, PRIDX has performed fairly well. These are the annual performance figures computed by Morningstar since 2007. 2007 2008 2009 2010 2011 2012 2013 2014 YTD PRIDX (%) 16.57 -49.93 55.69 20.47 -14.08 26.00 24.37 -0.43 10.80 Category (FR) 12.03 -49.02 49.24 23.04 -14.72 22.20 26.61 -5.40 9.75 Percentile Rank 34 58 17 77 31 11 60 15 56 Source: Morningstar Mutual Fund Ratings Lipper Ranking : Funds are ranked based on total return within a universe of funds with similar investment objectives. The Lipper peer group is International Small-Cap 1 Yr – #19 out of 168 funds 5 Yr – #31 out of 122 funds 10 Yr – #11 out of 67 funds Morningstar Ratings : Category is Foreign Small/Mid Growth Overall 5 Stars Out of 130 funds 3 Year – 4 Stars Out of 130 funds 5 Year – 4 Stars Out of 113 funds 10 Year – 5 Stars Out of 67 funds Fund Management Justin Thomson has managed the fund since August, 1998. He has an M.A. from the University of Cambridge. Regional Exposure (as of May 31, 2015) Europe 41.3% Pacific Ex-Japan 26.1% Japan 21.2% Latin America 2.7% North America 1.7% Middle East & Africa 1.0% Country Exposure (as of May 31, 2015) Japan 21.2% United Kingdom 15.7% China 8.4% Germany 5.8% India 4.1% France 3.4% Spain 3.4% South Korea 3.0% Australia 2.9% Switzerland 2.9% Comments PRIDX is a good way for individual investors to gain exposure to rapidly growing small/mid cap companies outside the U.S. It would be very difficult and costly for retail investors to purchase most of the stocks in this fund individually, given the complexities of foreign stock exchanges, currency conversions etc. I discovered PRIDX from a relative strength trend model run on the funds in the Citigroup 401K plan. PRIDX has recently popped up to the top of the list, and there are also signs that the fund has been attracting inflows lately. Here are some recent assets under management figures for PRIDX taken from the fundmojo web site: Feb. 2015 $3.53 Billion Mar. 2015 $3.88 Billion Apr. 2015 $4.12 Billion May 2015 $4.28 Billion I believe that if new money continues to flow into international small cap funds, it will boost the performance of the underlying stocks in the PRIDX portfolio. Back in January, hedge fund AQR and Tobias Moskowitz, a finance professor at Chicago’s Booth School of Business, published a research paper entitled ” Size Matters, If You Control Your Junk “. It found that small companies have outperformed larger companies when the quality of the companies is taken into account. Of course, it is well known that businesses with steady earnings greatly outperform highly speculative penny stocks. But when comparing companies in the same industry, the small, high-quality companies have outperformed larger, high-quality companies. I believe that PRIDX is a good way to invest globally in stocks of smaller, higher-quality companies. If it continues to attract inflows, this should benefit fund performance. Disclosure: I am/we are long PRIDX. (More…) I wrote this article myself, and it expresses my own opinions. I am not receiving compensation for it (other than from Seeking Alpha). I have no business relationship with any company whose stock is mentioned in this article.
Irish Midyear Review

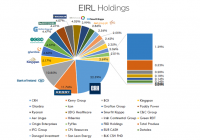
Summary Ireland is predicted to have the highest GDP growth among EU countries in 2015. EIRL has gained over 13% during first two quarters of 2015. Irish economy is quickly recovering due to good economic policy and a favorable macroeconomic climate. Concern over Greece may dampen growth in H2 2015 while the domestic real estate boom remains a longer-term worry. EIRL is poised to be a solid long-term investment for those seeking exposure to Eurozone’s fastest growing economy. ETF Overview The iShares MSCI Ireland Capped ETF (NYSEARCA: EIRL ) is a passive ETF which provides exposure to the Irish equity market. It seeks to track the MSCI All Ireland Capped Index. It’s a relatively costly ETF with a 0.48% expense ratio (although this relativity depends on whether you are used to investing in mainstream inexpensive ETFs or more costlier exotic ones). It also trades at a 0.86% premium to its NAV as of 2nd July. Nonetheless, if you are looking for sole exposure to the Irish equity market, EIRL is the only choice available today. EIRL is comprised of 25 constituents with several holdings representing a sizeable portion of the fund. The breakdown of holdings since adjustment in July 2015 is as follows: (click to enlarge) (Source: Own graph based on iShares data) The largest holding is CRH plc (NYSE: CRH ) – the parent company of an international building materials group. The second largest holding is the food and beverage corporation Kerry Group ( OTCPK:KRYAF ), taking 11.76% of the slice. The third largest holding is the national Bank of Ireland ( OTCPK:IRLBF ) with a 10.85% share. Overall, the top ten holdings represent almost ¾ of the overall fund and marked changes in the share price of the top three companies in particular can sway the ETF significantly. As result of this top-heavy composition, the ETF is heavily exposed to materials and consumer staples. Consequently, the performance of the ETF depends also on the general movement in these sectors. (Source: iShares) From 1st January until 1st July, EIRL has appreciated 13.03%. EIRL’s growth during these six months dwarfed that of SPDR S&P 500 Trust ETF (NYSEARCA: SPY ) which gained one percent over the same period. It also vastly outperformed the Vanguard FTSE Europe ETF (NYSEARCA: VGK ), one of the most liquid and inexpensive passive full-replication ETFs providing exposure to major European markets (including Ireland). EIRL data by YCharts The key metrics of EIRL as compared to SPY and VGK are summarized in the table below: ETF Comparison EIRL SPY VGK Issuer iShares SSGA (SPDR) Vanguard Expense Ratio 0.48% 0.09% 0.12% Shares 2.7m 819.19m 264m 3m avg vol. 33,327 102.64m 4.64m P/E Ratio 21.50 19.09 20.70 Equity Beta 1.25 1.00 1.09 Div. Yield 1.33 1.87 3.28 (Source: ETFdb , Yahoo! Finance ) Macroeconomics Far from being one of the original PIIGS, Ireland has performed an incredible turnaround in its economic fortunes following its bailout by the Troika. A period of austerity has allowed the country to decrease its budget deficit to within 3% of GDP and report a 4.8% GDP growth in 2014, the highest in Europe. Similarly, Ireland is predicted to grow the fastest in the EU this year with an estimated 3.8% GDP growth. Earlier this year, the Irish Central Bank expressed a very auspicious view about the state of Irish recovery in one of its quarterly bulletins: The momentum of recovery in the Irish economy continues to build and broaden, with domestic demand now making a significant positive contribution to growth. While the strength of net export growth was an important driver of the preliminary estimate of 4.8 per cent GDP growth last year, the recovery in the economy has become more balanced over the past year. Domestically, the continued strong increase in investment spending has been supported by the beginning of a recovery in consumer spending, which is showing signs of gradually strengthening. The pick-up in consumption has benefited from continuing favorable labor market developments, in particular growth in employment, which is helping to boost incomes. With consumer and investment spending both growing, domestic demand added to growth last year for the first time since 2007. (Source: Central Bank Quarterly Bulletin Q2 ) The unashamedly enthusiastic tone of the Central Bank can be forgiven given the years of hardship and turmoil, but it is worth pointing out one important detail about the reported 4.8% GDP growth in 2014. As one of the leading Irish economy commentators Constantin Gurdgiev in another SA article pointed out, up to 43% of Irish growth in 2014 can be attributed to the ongoing shift by the MNCs from profit-booking to cost-based transfer pricing, otherwise known as “contract manufacturing.” In essence, low-margin activities are outsourced abroad by MNCs and the resulting revenues are booked into Ireland. This will also skew any 2015 growth figures, so in effect some of the miraculous Irish GDP growth may well be illusory. Despite all this, exports did grow by 12.6% in 2014. In part, this was due to stronger demand from the U.K. and the U.S. (thanks to a weaker Euro). Although, it would be a mistake to attribute export growth entirely to a more favorable foreign exchange rate. This chart from the Q2 Bulletin based on CSO (Irish statistical agency) figures shows the extent of the rebound in the volume of industrial production in 2014. This growth was helped by strong growth in construction, pharmaceuticals and in the traditional Irish-owned sector which includes food and beverages. (Source: Central Bank Quarterly Bulletin Q2) In light of this, it’s important to remind that the top 5 constituents of EIRL include two construction materials companies (CRH and Kingspan ( OTC:KGSPY )) and two food and beverage companies (Kerry Group and Glanbia ( OTCPK:GLAPY )). Speaking of construction, one of the biggest drivers of Irish economy in 2014 was the staggering rise in property prices , topping Knight Frank’s global house price index with a 16% leap. Once again, the official graphs from the Central Bank show the all too familiar trend from the days of the Celtic Tiger. (click to enlarge) (Source: Central Bank Quarterly Bulletin Q2 ) Building and construction investment grew by about 9% in 2014, and while the surge in construction and real estate prices is certainly a boon to companies in the materials sector in particular. To everyone else, it’s yet another cost of living eating away at Ireland’s competitiveness in Europe, which Ireland tries to make up for with its near tax haven status. The plan seems to be working because earlier this year the unemployment rate dipped below the 10% line – a noticeable improvement over the 14.5% rate that pervaded in Ireland for quite some time. Interestingly, Ireland is still only middle of the pack among its EU peers in relation to youth unemployment (15-24 year olds) which stands just above 20%. (click to enlarge) (Source: The Economist ) The markets seem convinced with the Irish economy. Two months ago, the National Treasury Management Agency (an agency which borrows on behalf of the Irish government) sold 10-year bonds at a yield of 0.64%. As a backdrop, in the thick of the financial crisis in 2011, Irish 10-year bond yields reached 14%. In early June, S&P revised the Irish credit rating by one level to A+ from A with a stable outlook, citing “Ireland’s improved fiscal performance, higher state asset sales, and robust economic performance”. European QE will also have had a significant effect on both equity performance and investor confidence in 2015. Recently, the bond yields have risen to roughly around 1.70% on fears over Grexit. The Greek question is indeed central to the performance of the Irish and European economies in the near future. However, the Irish government officials maintain that the fallout from a possible Grexit on the Irish economy will be minimal and that there would be few contagion effects. Although the ECB may have spent four years insulating the Eurozone from contagion effects, it is in fact investor expectation that drives the markets, so there is definite risk of some uncertainty if Greece does exit the euro. Given that the Greeks voted No in the referendum, this possibility increases significantly. Major Holdings’ Performance EIRL’s major holdings had a great half year on the back of European QE and improving Irish economy. Construction materials companies had a particularly good run, with Kingspan gaining over 55% during the first six months of 2015. (Source: Own graph/research) CRH plc. CRH stock grew by 28.14% over the half year, continuing its run since late 2014 when the company announced an acquisition deal worth €6.6bn with Lafarge ( OTCPK:LFRGY ) and Holcim ( OTCPK:HCMLY ). The company reported “a satisfactory start” to 2015 in line with expectations, with continued momentum in Americas and sluggish growth in Europe. Over the second half of the year, the company expects Europe’s favorable monetary policy to “support organic improvement” across its main markets. Kerry Group Kerry Group gained over 14% in the year to date; however, the Group is faced with volatile food prices and a deflationary environment, which is expected to last into H2 2015. In Q1, the Group reported an increase in profit margin of 20bps despite challenges in developed markets and uncertainty in developing ones. The Group expects growth ahead of its markets with a good innovation pipeline and a well-positioned brand portfolio. Bank of Ireland BOI grew by around 14% to date. The bank still maintains tight cost controls and is focused on improving the quality of its assets. The bank recently delisted from NYSE and terminated its ADR facility. Otherwise, Bank of Ireland reports positive consumer sentiment, an increase in lending in line with expectations and a favourable economic environment. A weaker Euro increased the Group profits due to U.K. Sterling operations. The bank is regarded as “well capitalized” with a CET 1 ratio above 10%. Conclusion EIRL is the only ETF providing direct exposure to the equity market of a country which is predicted to be a growth champion in Europe in 2015. The outlook for Irish economy is certainly positive, if somewhat overstated. Ireland has adhered to its bailout program and learned a lot about banking regulation in the process. Therefore, the biggest foreseeable challenges are the continually deteriorating situation in Greece, where voters have voted “No” to a compromise with international creditors and the steep rise in real estate prices, which can take bubble-esque proportions. As Bertie Ahern, Ireland’s Taoiseach during the prosperous Celtic Tiger years quipped in 2006: “the boom is getting boomier.” Since the ETF is fairly illiquid, it makes sense as a more long-term investment and certainly the long-term fortunes of the Irish economy seem favorable, if a little burdened by public and sovereign debt. Editor’s Note: This article covers one or more stocks trading at less than $1 per share and/or with less than a $100 million market cap. Please be aware of the risks associated with these stocks. Disclosure: I/we have no positions in any stocks mentioned, and no plans to initiate any positions within the next 72 hours. (More…) I wrote this article myself, and it expresses my own opinions. I am not receiving compensation for it (other than from Seeking Alpha). I have no business relationship with any company whose stock is mentioned in this article.

Tekla Life Sciences Investors Fund: Good Performer, But Not A Reliable Income Play

Summary Tekla Life Sciences Investors Fund has a solid long-term performance record. But HQL and its dividends can be volatile. Still, if you like healthcare and are willing to take on some biotech risk, you might want to take a look at this CEF. Tekla Life Sciences Investors Fund (NYSE: HQL ) has an impressive long-term performance record, which is probably why a frequent reader asked me to take a look at it. However, what it doesn’t offer is a consistent distribution. Although that might scare off income-oriented investors, it’s still worth a deep dive for anyone thinking about investing in the life sciences space. But risk is the key word here. What the fund does HQL is a closed-end fund, or CEF, that invests in the life sciences arena. What exactly does that mean, particularly since the fund’s siblings invest in similar securities? Well, according to the fund, it can invest in areas such as biotechnology, pharmaceutical, diagnostics, managed healthcare, medical equipment, hospitals, healthcare information technology and services, devices and supplies, and agriculture and environmental management industries. Up until the last two, the fund sounds like your run-of-the-mill healthcare offering. The thing is, siblings Tekla Healthcare Investors (NYSE: HQH ) and Tekla Healthcare Opportunities Fund (NYSE: THQ ) have broad enough mandates that there’s some overlap in what each invests in and there’s notable overlap in their top holdings. So it’s hard to suggest that HQL is a massively differentiated fund within the family. But that doesn’t mean it isn’t different. For example, at the end of March, HQL had the heaviest weighting of the three funds in biotech and biopharmaceuticals at roughly 60% of assets. Its siblings HQH and THQ had around 50% and 35%, respectively. That really makes THQ the most aggressive of the trio, something that has been a boon to performance over the last few years. For example, the fund’s net asset value, or NAV, total return was 42% over the last 12 months through the end of May. (Total return includes the reinvestment of distributions). Over the trailing three- and five-year periods, its annualized total return was roughly 35% and 31%, respectively. That’s a heck of a showing. In fact, in March, management made note of the strong performance, warning investors that: “…we are favorable on the fundamentals of the healthcare and biotech sectors. However, we also want to express a note of caution. After several years of outperformance, valuations in the healthcare and biotech sectors, while reasonable relative to other sectors on a growth adjusted (P/E divided by G) basis, they are high on a trailing twelve month Price/Earnings basis.” In other words, we like the space, but don’t be surprised if there’s a pullback. Some things to note It’s also worth noting that the fund has the leeway to invest up to 40% of assets in “restricted” securities. Such illiquid investments are usually, though not exclusively, start-ups that need cash but aren’t publicly traded. These securities have to be valued by management, even though there’s no ready market for them. This is a risk you should keep in the back of your mind if there is a notable downturn. That said, the fund doesn’t make use of leverage, which means a downdraft wouldn’t be exacerbated by debt. The fund doesn’t use options, either, so it is a pure-play stock fund. Taking these facts a step further, it means that the fund’s distributions have to be covered by dividends, interest, and trading activities. The fund’s distribution policy is to pay 2% of its net asset value per quarter to shareholders. On an annual basis, that means a roughly 8% distribution target. That’s high enough to be meaningful, but low enough that you can probably expect long-term performance to make up for difficult periods that may require distributions to be paid out of capital. Clearly, with such solid performance, that hasn’t been an issue of late. In fact, since 2010, the fund’s NAV has done nothing but go up every year. And in a big way, too. At the start of the decade, the NAV was roughly $11.30, while more recently, the NAV was in the $29 range. That’s even more impressive when you consider that it’s paid out around $7 a share in distributions over that span. The only problem here is that the distribution isn’t a reliable figure; it bounces around with the fund’s NAV because of the 2% per quarter policy. In other words, you can’t count on the distributions paid over the past year to be any indication of what will be paid in the future. And, perhaps more important, just when you may be most in need of stable income, like during a market downdraft, the fund’s distribution is likely to shrink. For income-focused investors, then, this is a big risk to note. Expense-wise, HQL’s costs are currently running at around 1.25% of assets. That’s down from a few years ago, when the number was 1.7%. So it’s not overly expensive to own today, but it has been in the past considering that it doesn’t use leverage or options. To be fair, however, it was a much smaller fund in the past than it is today. Own it, don’t own it? On the whole, HQL is a decent fund. At present, it’s heavily focused on the biotech space, but for an aggressive investor, that might be exactly what’s desired. However, that brings the issue of risk to the fore, which is the big-picture consideration here. Despite a solid performance record over the past few years, this fund isn’t for the faint of heart. Biotech is an often volatile space and HQL is heavily invested there. What’s this mean? Vanguard Health Care Fund (MUTF: VGHCX ), a more broadly diversified mutual fund, had a standard deviation, a measure of volatility, of around 9 over the trailing three- and five-year periods. HQL’s standard deviation over those spans was 15. These two funds aren’t apples to apples, nor are they apples to oranges. For investors looking at the healthcare sector, HQL is a risky option. Moreover, anyone looking specifically for income shouldn’t be expecting a steady flow of distributions from HQL. Indeed, the fund’s policy specifically builds in distribution cuts during bad times. If you can stomach those two risks, HQL’s shares currently trade at an around 2% discount to NAV. That’s not particularly large, but is in line with its recent past. The discount has been much wider, coming in at an average of more than 5% over the trailing five years, according to the Closed-End Fund Association . Over the trailing 10 years, the average discount was nearly 8%. So while investors aren’t bidding the shares up beyond NAV, there’s room for negative sentiment to push them down further than they are at present if history is any guide. And if biotech goes out of favor, I’d expect that to happen. Would I buy HQL? No. I would be more comfortable with a fund that’s more diversified. However, that doesn’t mean it’s a bad fund for someone with a more aggressive bent. Just make sure you know what you are buying when you go in. Disclosure: I/we have no positions in any stocks mentioned, and no plans to initiate any positions within the next 72 hours. (More…) I wrote this article myself, and it expresses my own opinions. I am not receiving compensation for it (other than from Seeking Alpha). I have no business relationship with any company whose stock is mentioned in this article.