Tag Archives: investing ideas

Aberdeen Indonesia Fund: Invest In The Indonesian Market’s Growth
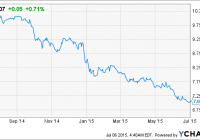
Summary Indonesia is on track for future economic growth, as GDP Growth and consumer spending are both projected to substantially increase. The Aberdeen Indonesia Fund is the most attractively valued fund, and provides exposure to strong companies in the banking and consumer products industries. The main risks of investing in Indonesia include exchange rate movements, inflation, and relatively high valuation of the consumer products industry; apart from this, invest looks very favorable. The Aberdeen Indonesia Fund is potentially the best way to gain exposure to Indonesia’s future growth. Emerging Indonesia is clearly on track for considerable future growth in 2015 and 2016, as the Asian Development Bank has projected GDP Growth of 6.4% and 6.3% in 2015 and 2016 respectively. Moreover, Indonesia’s president has set a target GDP growth of 7% for 2017 , as infrastructure development and foreign direct investment are expected to attribute to this growth. Future growth in Indonesia’s economy, in multiple industries, provides the opportunity for investors to profit off of the current setback. However, Exchange Traded Funds are not allows an accurate reflection of a country’s performance, and choosing the appropriate vehicle is crucial. Based on an examination of valuation, I have decided that the Aberdeen Indonesia Fund (NYSEMKT: IF ) is the most appropriate fund for investors who wish to profit from Indonesia’s growth. The Aberdeen Indonesia fund is a closed end fund, and has the comparative advantage of having lower valuation than Indonesian Exchange Traded Funds. Moreover, its liquidity looks very favorable, as its average trading volume is 18,579 . The fund currently has a P/E ratio of 8.8 , which is considerably lower than other alternatives; the Market Vectors Indonesia Index ETF (NYSEARCA: IDX ) has a P/E ratio of 16 and the iShares MSCI Indonesia ETF (NYSEARCA: EIDO ) currently has a P/E ratio of 12 . Another key advantage of this fund is its Beta of 0.78, making it less volatile in the market. Although the fund has had a 1 year return of -20.86% , an assessment of Indonesia’s economy and respective industries of the fund’s holdings provides a favorable outlook; its current valuation and past performance should merely be viewed as an opportunity to buy while it is low. The price of the fund has been on a sharp decline, which can mainly be attributed to its slowed GDP growth, which is expected to recover. An assessment of the performance of the fund’s main holdings further attributes to the logic of having a bullish outlook of Indonesia, specifically through this fund. Macroeconomic Outlook Examining Indonesia’s past macroeconomic performance, particularly in 2012, it is clear that a rebound in the country’s growth is highly feasible. The country is on track for recovery from the currently slowed GDP growth of 4.7, and will return to the higher growth experienced in 2012. If growth goes as anticipated up to 2017, Indonesia will be able to surpass its economic performance in 2012. (click to enlarge) Source(Trading Economics) Inflation is another struggle in Indonesia, that has a more positive outlook for 2015 and 2016. The country’s finance minister projected that inflation rates would fall to 4.5-5% in 2015, representing recovery and a return to levels in late 2014. However, 2015 has so far only produced slight recovery from the inflation rate during the beginning of 2015. (click to enlarge) Source(Trading Economics) 2015 has also witnessed a significant improvement of the country’s balance of trade, as the country began to have a trade surplus in 2015. The turnaround in 2015 is attributed increased economic growth and the recovery of commodity prices; with further growth projected for 2015 and 2016, Indonesia’s trade surplus certainly has room for increase. (click to enlarge) Source(Trading Economics) Positive Overall Outlook Combined with FX/Inflation Risks Investment into Indonesia overall looks very favorable, especially into a fund with very low valuation. Indonesia is on track for recovery in GDP Growth, and its balance of trade has drastically improved in 2015. Areas of concern for investors include inflation, which is expected to improve to conditions in 2014. Since 2015, the Indonesia Rupiah has fluctuated approximately between 12,500 and 13,400, stabilizing at 13,332 in June of 2015. The rupiah has been the worst performing currency in Asia, and in December the Rupiah hit its lowest since the economic crisis 1978-1979 Asian Financial Crisis. I believe that the low valuation of the fund, increased GDP growth, and improved balance of trade are strong enough to counter the inflation and currency risks. Moreover, the financial performance of the fund’s holdings has been very impressive, considering the issues of inflation and slowed economic growth. Fund Holdings The fund mainly invests into the banking and consumer products industries, while one of the holdings operates in the construction industry. Banking Industry An observations of the fund’s holdings in this industry produces a favorable outcome, with attractive valuation and financial performance. The average P/E ratio for the top holdings in this industry is 13.6, which is substantially lower than the average P/E ratio of 21.89 of the Jarkata Stock Exchange Composite Index. The average growth in net revenue for 2014 was 11.8% The average growth in net income for 2014 was 8.1% Overall the growth was not very strong, but is still relatively impressive, considering that this industry was able to achieve growth despite the country’s decrease in GDP growth. With attractive valuation, and increased growth projected in the future, this industry can be considered a strength of the fund’s holdings. Despite excellent financial performance and attractive valuation, a survey from PWC characterizes the industry in 2015 as being volatile and uncertain, along with progression in a variety of areas. Loan growth is projected to grow around 10% to 20% in 2015, mainly driven by Small and Medium Enterprise growth. Credit, Liquidity, and Operational risk remain major threats for banks, which can be offset by enhancing the processes of monitoring and distributing loans, as well as limiting exposure to high risk industries. Banks will catalyze the projected growth in infrastructure, although it is only estimated to be less than 10% of its portfolio. Bankers stated that the Rupiah exchange rate will continue to be under pressure, but expects inflation to continue easing. Despite uncertainty ahead, particularly regarding exchange rate movements, the banking industry has multiple positive outlooks, and the specific holdings of this CEF are very attractive. Consumer Products Consumer spending has been on a consistent rise since 2012, attributed to the high performance of this industry and the fund’s holdings. The lag in GDP growth did not hinder growth in consumer spending, and with increased GDP growth projected for 2015 and 2016, the future outlook for this industry is very favorable. Consumer spending is projected to increase to 1,231,249 by the 2nd quarter of 2016, and to 1,243,356 by 2020. There is still room for growth in this industry, although growth will slow by 2016; although entering in 2012 would have been most strategic, there is certainly room for profit in the current environment. (click to enlarge) Source(Trading Economics) Eyes have already been on Indonesia as a destination for the consumer products industry. Euromonitor calculated in 2014 that Indonesia will gain 80 million new consumers , accounting for 40% of new consumers in the ASEAN region. Strong growth is clearly ahead for this industry, which may provide suitable justification for the valuation of the holdings in this industry: The average P/E ratio for the holdings in this industry is 31.2, which is not very attractive for an emerging market. However, the high potential for future growth, combined the projected GDP growth, is substantial enough to justify this valuation. Net Income increased by 28.6% in 2014, while net revenue increased by 11.5%; these companies are an accurate reflection of the industry’s growth. Conclusion Indonesia certainly holistically presents itself as an attractive investment opportunity, with the Aberdeen Indonesia Fund being an appropriate vehicle. For those wishing to navigate the acceptable amounts of risk presented, the opportunity for profit is incredibly feasible due to Indonesia’s projected growth, the overall favorable outlook of the banking and consumer products industry, and the attractive valuation of the Aberdeen Indonesia Fund. Disclosure: I/we have no positions in any stocks mentioned, and no plans to initiate any positions within the next 72 hours. (More…) I wrote this article myself, and it expresses my own opinions. I am not receiving compensation for it (other than from Seeking Alpha). I have no business relationship with any company whose stock is mentioned in this article.
Aetna Finally Agrees To Buy Humana: ETFs In Focus

The insurance corner of the health care sector has been the hottest lately as the five big managed health care insurers are in talks of consolidation. In the latest match-up merger game between Aetna (NYSE: AET )-Humana (NYSE: HUM ) and Aetna-UnitedHealth (NYSE: UNH ), it seems that Humana has finally won following weeks of speculation. Aetna-Humana Deal in Focus In the deal announced on the eve of the July Fourth weekend, Aetna will buy Humana for about $37 billion, or about $230 per share in a cash-and-stock deal. Per the terms, Aetna will pay $125 in cash to Humana shareholders, a 23% premium to its closing price as of June 2, and 0.8375 share for each Humana share. Aetna’s shareholders will own about 74% in the combined company, while Humana’s shareholders will own the rest. The combination, if successful, would be the largest ever in the managed health care insurance space, dwarfing the recently announced $28 billion takeover offer of Chubb Corp. (NYSE: CB ) by ACE (NYSE: ACE ) and Anthem’s (NYSE: ANTM ) $16.6 billion purchase of WellPoint in 2004. The deal would push Aetna close to the second-largest insurer – Anthem – in terms of membership and would nearly triple its market share in the rapidly growing Medicare Advantage business. It will also bolster Aetna’s presence in the state and federally funded Medicaid program and Tricare coverage for military personnel and their families. With this, the combined company is expected to generate revenues of $115 billion in 2015, with 56% coming from government-sponsored programs such as Medicare and Medicaid. The acquisition, expected to be completed in the second half of next year, has already been approved by the board of directors of both companies and is seeking approvals from the shareholders and regulators. The transaction will be neutral to earnings in 2016 but accretive to earnings in mid single digits in 2017 and low double digits in 2018. The proposed merger has put the spotlight on the iShares U.S. Healthcare Providers ETF (NYSEARCA: IHF ), which could be the best way for investors to tap the opportunity arising from the AET-HUM deal. The shares of HUM are up 3.4% in the pre-market trading today while Aetna dropped over 6%. IHF in Focus This ETF follows the Dow Jones U.S. Select Healthcare Providers Index with exposure to companies that provide health insurance, diagnostics and specialized treatment. In total, the fund holds 51 securities in its basket with Aetna occupying the third position accounting for 6.6% share and Humana taking up the seventh spot at 4.6%. The fund has amassed over $1 billion in its asset base while volume is moderate at about 87,000 shares per day on average. It charges 43 bps in annual fees and expenses and has gained 20.4% so far this year. The product has a Zacks ETF Rank of 1 or ‘Strong Buy’ rating with a Medium risk outlook. Other ETF Options While IHF is undoubtedly the solid pick in the health care space to take advantage of the planned merger, other choices are also available from the large-cap space. Among them, the ValueShares U.S. Quantitative Value ETF (BATS: QVAL ) provides a decent exposure to both Aetna and Humana with a combined share of 5.8%. The ETF invests in the cheapest highest quality value stocks, holding 41 stocks in its basket. It has amassed $55.5 million in its asset base while volume is paltry at around 16,000 shares. It charges 79 bps in annual fees. The Direxion iBillionaire Index ETF (NYSEARCA: IBLN ) could also be the way to capitalize gains resulting from the Aetna-Humana deal. The fund provides an opportunity to invest like billionaires by tracking the iBillionaire Index. It has an equal-weighted portfolio of 31 large-cap stocks with Humana as one of its holdings. The product has AUM of $31.7 million and charges 65 bps in fees from investors. Volume is low, exchanging 12,000 shares in hand per day. Original Post

Raining On The All Seasons Portfolio

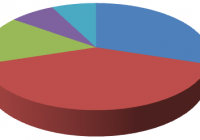
Investors are hungry for success stories, especially tales that include high returns with low risk. And the investment industry is always happy to stoke that appetite. One of the most popular stories today is the so-called All Seasons portfolio, whose virtues are trumpeted in the massive bestseller Money: Master the Game , by motivational speaker Tony Robbins. The book has been out since last November, and I thought the hype would blow over quickly, but I’m still getting inquiries about it, so I thought I’d take a closer look. The All Seasons portfolio was created by Ray Dalio of Bridgewater Associates , one of the largest hedge fund managers in the world. It’s based on Dalio’s similarly named All Weather fund , which reportedly has more than $80 billion USD in assets. The portfolio has the following asset mix: 30% Stocks 40% Long-term bonds 15% Intermediate bonds 7.5% Gold 7.5% Commodities In a backtest covering the 30 years from 1984 through 2013, the All Seasons portfolio had an annualized return of 9.7% (net of fees) and only four years with a loss. Its worst year was a modest -4% in 2008. With a risk-return profile like that, it’s no wonder so many investors have been attracted to the All Seasons portfolio. In fact, a service run by Robbins’ own advisor has been swamped with requests from investors who want a piece of this seemingly miraculous strategy. So, is the All Seasons portfolio really a recipe for stellar returns with minimal risk? Or is it just another example of investors chasing hypothetical past performance? The reasons for the seasons The All Seasons portfolio is based on the idea that asset prices move in response to four forces: rising economic growth, declining economic growth, inflation and deflation. In each of these economic “seasons,” some asset classes thrive and others suffer. For example, when growth is strong and inflation is low, stocks are likely to perform well, whereas commodities and gold benefit from rising growth and rising inflation. Bonds do well when economic growth and inflation are both falling. By including all of these asset classes in your portfolio, you’ll do well under all conditions. It’s like travelling with sunscreen, an umbrella, a swimsuit and a parka. There’s nothing wrong with this general idea: most investors understand that a portfolio should include asset classes with low (or even negative) correlation . Nor is it an original thesis: it’s very similar to what Harry Browne wrote in the early 1980s. Browne’s Permanent Portfolio was also based on the principle that you should hold asset classes that would thrive during four economic scenarios: stocks for prosperity, cash for recessions, gold for inflation protection, and long-term bonds for deflation. (If you’re interested in learning more, read Part 1 and Part 2 of my 2011 interview with Craig Rowland, co-author of The Permanent Portfolio .) Was the performance really remarkable? But while the premise of the All Seasons portfolio is reasonable, there’s nothing astonishing about its performance during the last 30 years. Moreover, anyone expecting it to deliver 9.7% with low risk in the future is likely to be disappointed. The returns were unremarkable. A 9.7% annualized return doesn’t mean much unless you compare it to the alternatives. The truth is that all diversified portfolios performed well during the last three decades. Despite the carnage of the dot-com bust at the turn of the millennium and the financial crisis of 2008-09, most of those 30 years were extremely kind to stocks. Late 1987 to the spring of 2000 saw the longest bull market in history, and the one we’re enjoying now ranks third all-time. From 1984 through 2013, the S&P 500 returned a whopping 11.1%. And what about bonds, which make up 55% of the All Seasons portfolio? In the US, long-term government bonds returned 9.4% during the period. In Canada, they did even better: the FTSE TMX Canada Long-Term Bond Index returned 10.3% over those 30 years. Once you consider the context, a 9.7% annualized return since 1984 isn’t remarkable at all. Anyone who stayed invested in a diversified portfolio would have seen similar results. The risk was not “extremely low.” OK, maybe the returns of the All Seasons portfolio were in line with a traditional balanced portfolio, but risk was much lower, right? In an article for Yahoo Finance , Robbins reports that the standard deviation of the portfolio during the 30-year period was 7.63%, which he declares is “extremely low risk and low volatility.” I’m not sure investors would agree with that assessment. If a portfolio has an average expected return of 9.7% and a standard deviation of 7.6%, that means in 19 years out of 20, its annual return can be expected to range between -6% and 25%. That’s not “extremely low volatility”: it’s about the same as that of a traditional balanced portfolio. In our white paper Great Expectations , my colleague Raymond Kerzhéro and I found that a portfolio of 40% bonds and 60% global stocks had a standard deviation of about 7.8% over a similar period (1988 to 2013). What about the fact that the All Seasons had only four negative years, all with only modest losses? Robbins and Dalio frequently compare the All Seasons portfolio to the S&P 500, which certainly saw much larger and more frequent drawdowns. But this is a totally inappropriate benchmark, as the All Seasons portfolio includes just 30% stocks. Dalio’s portfolio holds 55% bonds, which are far less volatile than stocks. More important, bonds only lose value when interest rates rise, and from 1984 to 2013, the yield on 30-year Treasuries fell from over 11% to about 3.5%. Any bond-heavy portfolio would have seen rare and modest drawdowns during that period. There were many disappointing periods. The long-term returns of almost any diversified portfolio look impressive, but unfortunately you can’t buy 30 years of performance in advance: you have to earn those returns by doggedly sticking to your plan even when it disappoints. And let’s be clear: the All Seasons portfolio would have tried your patience many times. While the portfolio never suffered huge losses, it would have significantly lagged a traditional balanced portfolio during the many periods when stocks delivered double-digit returns. That’s why this strategy – and the Permanent Portfolio, for that matter – had few followers during the 1980s and 1990s. A portfolio with just 30% stocks would have been met with derision during that long, giddy bull market. Gold would have been even harder to hold. Sure, it glittered during the most recent financial crisis, but during the 21 years from 1984 through 2004, the real return on gold in Canadian dollars was -2.3% annually. Would you have had the guts to hold it through two money-losing decades? Don’t make the mistake of thinking it’s easy to stick with a strategy when it underperforms during strong bull markets, as the All Seasons portfolio is almost certain to do. Bridgewater’s own All Weather fund returned -3.9% in 2013 , one of the best years for stocks in recent history (the MSCI World Index was up almost 34% in Canadian dollars). My guess is that Dalio’s clients took little comfort in the fact that strategy performed well in historical backtesting. Couldn’t stand the weather My goal here is not to beat up on the All Seasons portfolio specifically: on the contrary, I wanted to show that in many ways it’s not fundamentally different from other balanced portfolios. My concern is that the All Seasons portfolio is presented as a magic formula that will dramatically outperform a traditional stock-and-bond portfolio with far less risk. The very name implies that it will perform well during all market conditions. But that wasn’t true over the last 30-plus years, and it’s even less likely to be the case during a period of low interest rates. (No one knows where rates are headed, but it’s absurd to expect 9% or 10% returns on bonds when yields are 1% to 3%.) A well-diversified, low-cost portfolio executed with discipline offers your best chance of enjoying market returns with moderate volatility. But there’s no secret recipe, no optimal asset allocation, and no reward without risk. Be skeptical of anyone who suggests otherwise.