Tag Archives: income

Electric Transmission In Transition – Sheltering $1 Billion A Year In Potential Future ROE
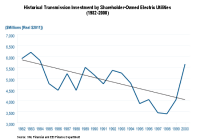
With an average FERC base-rate ROE of 10%, electric transmission firms could earn $1 billion a year in allowed returns from investments made 2014-2017. Last fall, the IRS ruled transmission firms could quality as a REIT structure. REIT structures could entice large utility firms to spin-off their transmission business. The electric transmission business may be starting to tiptoe into a vast sea of change. With the exception of ITC Holdings (NYSE: ITC ), the majority of transmission assets are held within much larger diversified electric utilities. For example, American Electric Power (NYSE: AEP ) owns the largest transmission network in the US with about 32,000 miles of line. First Energy (NYSE: FE ) is not far behind with 24,000 miles. Other major utilities with substantial transmission assets are: Southern Company (NYSE: SO ), Duke Energy (NYSE: DUK ), PG&E (NYSE: PCG ) and Edison International (NYSE: EIX ). Pacific Corp is building 4,300 miles of new lines and Xcel (NYSE: XEL ) has 3,300 miles of projects on the books. AEP is building 27 projects consisting of 3,200 miles of lines in partnership with others. Combined, AEP’s projects total $9 billion. The partnership of Duke and American Transmission is not far behind with 2,700 miles of additions. American Transmission is a joint venture of several utilities and municipalities in Wisconsin. Even the Oracle of Omaha is collaborating with AEP in a 50-50 partnership to build transmission projects in Texas. It is common knowledge that the grid has suffered from years of neglect and is demonstrated by the graph outlining transmission investments from 1982 to 2000. After hitting bottom at under $3.5 billion, annual investments are stabilizing over the next three years at $20 billion a year. The following graph outlines industry wide investments from 2008 to projected 2017. Source: eei.com (click to enlarge) Source eei.com About 45% of cap ex is dedicated to expansion of the network, and an additional 15% goes for replacement due to age, obsolescence, and storm damage. Between 2014 and 2017, there are expected to be 22,800 additional miles of transmission lines in the US. The balance of investments is grid network improvements such as fundamental, advanced technologies, and enhanced security. Projected Transmission Capital Expenditures by Type of Activity Years 2014 to 2017 Source eei.com Transmission investments industry-wide are expected to total $78 billion between 2014 and 2017. If 50% if this investment is considered equity and the FERC-allowed average ROE is 10%, the total industry-wide allowed return could translate to an additional $1 billion a year from investments made from 2014 to 2017. Historically, FERC regulated assets are more profitable than state regulated assets. For example, prior to FERC’s recent ruling in New England, ITC could earn between 12% and 13% return on equity vs. the most recent state average allowed return of just under 10%. Below is a chart from eei.com (pdf) outlining the average state regulated rates going back to 1990. The chart is from their quarterly report “Rate Case Summary” Source eei.com The FERC is under pressure to reevaluate its rate structure in some regions in the country. For example in the Northeast, the FERC settled a complaint by reducing the allowed return on transmission assets. Consumer advocates are pushing the New England rate structure as a nationwide model. In a press release , last year, the FERC announced a new maximum allowed base ROE of 10.57% for assets in the New England region, and was a reduction from the previous rate. In addition, there are several incentive clauses that could increase the base rate, such as a 0.5% incentive for stand-alone, independent companies. Currently ITC is the only publicly traded utility that qualifies for this incentive. More information on ITC can be found in a SA review from last May here and more information on the transmission business from the Edison Electric Institute here . But that may soon change. The dawn of utility asset financial engineering is upon us. The spin offs of natural gas pipelines and mid-stream assets into limited partnerships, along with the recent separation of NRG’s generation into NRG Yield (NYSE: NYLD ), foretells of structural changes within the transmission sector. Last fall, the IRS ruled that entities such as electric transmission assets could quality for a REIT structure. From a Moody’s article last Oct: Large US power transmission utilities are actively exploring the feasibility of using the real estate investment trust structure as a financing vehicle, says Moody’s Investors Service. It is plausible that utility REITs might emerge as early as late next year (2015). “Many US utilities are taking a look at their transmission assets to assess whether utilizing a REIT structure makes sense, given the abundance of these types of assets that produce steady cash flows,” says Moody’s Associate Managing Director Jim Hempstead in the report “US Utility Transmission Assets: Power Transmission REITs Poised to be Sector’s Next Phase of Financial Engineering.” Utilities have been pursuing “financial engineering” structures because yield-hungry investors assign premium valuations to vehicles with steady dividend growth trajectories, says Moody’s. From an article on publicpower.org explaining the IRS ruling and reporting on Moody’s report: In 2014, the Internal Revenue Service clarified existing rules that define what constitutes real estate. As a result, the REIT sector has grown as companies look to spin off their assets into new companies that are effectively exempted from corporate taxes as long as they operate within REIT guidelines. The 2014 IRS clarifications have helped open the REIT structure to non-traditional sectors, such as electric transmission in the case of utility companies; or fiber optic and copper networks, in the case of telecommunications companies. Potential REIT candidates in the utility sector include Texas-based transmission and distribution utilities and large transmission-only companies. Transmission assets make for an alluring REIT because they provide steady income that allows for dividends, a key feature for REIT investors. Utilities that create REITs out of their transmission assets are separating a yield asset from their growth assets, Moody’s said. “Regulatory contentiousness risk might increase because customer groups will object to future rate requests more aggressively,” the report said. “Other regulatory considerations that are likely to become more active include discussions over the appropriate cost of capital, the authorized return on equity and cost allocations.” Moody’s still sees ITC’s FERC-regulated transmission assets as a candidate for becoming a REIT. It also sees American Electric Power Co. Inc., FirstEnergy Corp., Xcel Energy Inc. and Entergy Corp., all companies that Moody’s said make transmission a core strategy, as likely candidates. Electric utility investors should be aware that a change in corporate structure also brings with it a potential credit downgrade as a higher portion of operating cash flow moves on to shareholders. Much like the REIT conversion craze that started in the timber industry in the last 1980s and leading to culmination of most timber companies now structured as REITs, the attraction of financial engineering transmission assets could be too tempting to avoid. All it will take is one to lead the way. ITC would be the most logical choice as it is already an independent firm. I expect larger utilities will then be under greater pressure to spin off their transmission businesses also as REITs. However, the impact of distributing greater portions of operating cash flow to shareholders to satisfy the REIT regulations, rather than reinvesting it as equity in additional growth projects, needs to be evaluated. Moody’s believes this will become a prominent topic of utility conversation by the end of this year. If they are correct, a new REIT sector will be born, offering the advantages of high shareholder distributions supported by federally regulated assets, which are more profitably than similar state-regulated investments. Author’s Note: Please review disclosure in Author’s profile. Disclosure: The author is long ITC, SO, AEP. (More…) The author wrote this article themselves, and it expresses their own opinions. The author is not receiving compensation for it (other than from Seeking Alpha). The author has no business relationship with any company whose stock is mentioned in this article.
Investing For Retirement Using Schwab Mutual Funds

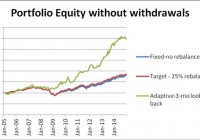
Summary Schwab offers a set of diversified mutual funds which can be successfully used for construction of investment portfolios with good withdrawal rates. A set of just three mutual funds, a bond, a large cap dividend equity growth, plus a small cap fund generates good returns with relatively low risk. From January 2005 to January 2015, a Schwab portfolio with fixed allocation could produce a safe 5% annual without any substantial decrease of the capital. Same portfolio with rebalancing at 25% deviation from the target allowed a safe 5% annual withdrawal rate with a smaller decrease of the capital. Same portfolio with momentum-based adaptive allocation could have produced a safe 10% annual withdrawal rate and 0.52% annual increase of the capital. This article belongs to a series of articles dedicated for investing in various mutual fund families. In previous articles we reported our research on Fidelity, Vanguard, T Rowe Price, and American Century mutual fund families. The current article does the same for Schwab family of mutual funds. The series of these articles is aimed at a broad spectrum of investors. They may be useful to small individual investors as well as to any large institution managing retirement accounts. The general methodology we use in selecting the funds for the portfolio was presented in a previous article. The portfolio includes three funds: one bond fund and two equity funds. The equity funds are complementary: one covers large capitalization stocks paying high dividends, the other fund contains small capitalization growth stocks. Historically, the selected funds have performed better than most other funds in their category. The mutual funds been selected for investment are the following: Schwab total bond market fund (MUTF: SWLBX ) Schwab Dividend Equity fund (MUTF: SWSCX ) Schwab Small Cap Equity fund (MUTF: SWDSX ) As in the previous articles, three different strategies are considered: (1) Fixed asset allocation. The portfolio is initially invested 50% in the bond fund and 50% equally divided between the two stock funds, without rebalancing. (2) Target asset allocation with rebalancing. The portfolio is initially invested 50% in the bond fund and 50% equally divided between the two stock funds and is rebalanced when the allocation to any fund deviates by 25% from its target. (3) Momentum-based adaptive asset allocation. The portfolio is at all times invested 100% in only one fund. The switching, if necessary, is done monthly at closing of the last trading day of the month. All money is invested in the fund with the highest return over the previous 3 months. The data for the study were downloaded from Yahoo Finance on the Historical Prices menu for three tickers: SWLBX, SWSCX, and SWDSX. We use the monthly price data from January 2005 to January 2015, adjusted for dividend payments. The paper is made up of two parts. In part I, we examine the performance of portfolios without any income withdrawal. In part II, we examine the performance of portfolios when income is extracted periodically from the accounts. Part I: Portfolios without withdrawals We report the performance of the portfolios under two scenarios: (1) no withdrawals are made during the time interval of the study, and (2) withdrawals at a fixed rate of the initial investment are made periodically. In table 1 we show the results of the portfolios managed for 10 years, from January 2005 to January 2015. Table 1. Portfolios without withdrawals 2005 – 2015. Strategy Total increase% CAGR% Number trades MaxDD% Fixed-no rebalance 79.75 5.98 0 -31.09 Target-25% rebalance 86.22 6.36 3 -31.09 Momentum-Adaptive 247.20 13.25 36 -14.74 The time evolution of the equity in the portfolios is shown in Figure 1. (click to enlarge) Figure 1. Equities of portfolios without withdrawals. Source: This chart is based on EXCEL calculations using the adjusted monthly closing share prices of securities. From figure 1 it is apparent that the rate of increase of the adaptive portfolio is substantially greater than the rate of the fixed and target allocation portfolios. Part II: Portfolios with withdrawals Assume that we invest $1,000,000 for income in retirement. We plan to withdraw monthly a fixed percentage of the initial investment. That amount is increased by 2% annually in order to account for inflation. In table 2 we show the results of the portfolios managed for 10 years, from January 2005 to January 2015. Money was withdrawn monthly at a 5% annual rate of the initial investment plus a 2% inflation adjustment. Over the 10 years from January 2005 to January 2015, a total of $535,920 was withdrawn. Table 2. Portfolios with 5% annual withdrawal rate 2005 – 2015. Strategy Total increase% CAGR% Number trades MaxDD% Fixed-no rebalance -0.21 -0.02 0 -36.32 Target-25% rebalance -0.01 -0.00 3 -37.39 Momentum-Adaptive 126.32 8.51 36 -20.50 The time evolution of the equity in the portfolios is shown in Figure 2. (click to enlarge) Figure 2. Equities of portfolios with 5% annual withdrawal rates. Source: This chart is based on EXCEL calculations using the adjusted monthly closing share prices of securities. To illustrate the advantage of the adaptive allocation strategy and the effect of withdrawal rates on the evolution of the capital, we give in Table 3 the results of simulations for the following withdrawal rates: 0%, 5%, 10%, and 12%. Table 3. Adaptive Portfolios with various annual withdrawal rates 2005 – 2015. Withdrawal rate % Total increase% CAGR% MaxDD% 0 247.20 13.25 -14.74 5 126.32 8.51 -20.50 8 53.77 4.40 -25.64 10 5.40 0.52 -30.04 The time evolution of the equity in the portfolios is shown in Figure 3. (click to enlarge) Figure 3. Equities of momentum-based portfolios with various annual withdrawal rates. Source: This chart is based on EXCEL calculations using the adjusted monthly closing share prices of securities. Conclusion The set of three Schwab mutual funds, selected for this study, perform well for all three strategies and generate sustainable returns at relatively low drawdowns. Between 2005 and 2015, the fixed target allocation with rebalancing was able to sustain withdrawal rates of up to 5% annually. The adaptive allocation algorithm was able to sustain withdrawal rates up to 10% annually without any decrease of capital. Additional disclosure: This article is the fifth in a sequence on investing in mutual funds for retirement accounts. To help the reader compare the past performance of various mutual fund families, I selected a benchmark 10-year time interval starting on 1 January 2005 and ending on 31 December 2014. The article was written for educational purposes and should not be considered as specific investment advice. Disclosure: The author has no positions in any stocks mentioned, and no plans to initiate any positions within the next 72 hours. (More…) The author wrote this article themselves, and it expresses their own opinions. The author is not receiving compensation for it (other than from Seeking Alpha). The author has no business relationship with any company whose stock is mentioned in this article.

Coca Cola, PepsiCo Earnings Stir Up Consumer Staples ETFs

The beverage space closed out 2014 on a sizzling note as two cola and food bellwethers – Coca Cola Co. (NYSE: KO ) and PepsiCo (NYSE: PEP ) – quenched investors’ thirst with better-than-expected earnings for Q4 ’14. In fact, 2014 will remain especially memorable for PepsiCo as the company beat the Zacks Consensus Estimate for both earnings and revenues in all four quarters. On the other hand, Coca Cola managed to beat on both lines in Q4 after posting mixed results in Q3. Let’s delve a little deeper. Impressive PEP Earnings & Dividend Hike On February 11, PepsiCo beat the Zacks Consensus Estimate for both earnings and revenues. Not only this, the food and beverage behemoth announced a 7.3% increase in annual dividend along with an authorization of a new $12 billion share buyback program. Pepsi’s fourth-quarter core earnings per share of $1.12 easily surpassed the Zacks Consensus Estimate of $1.08 by 3.7% and year-ago earnings by 6% helped by higher organic revenues, improved margins and lower taxes. Total sales of $19.95 billion – down 1% year over year – beat the Zacks Consensus Estimate of $19.78 billion. A stronger snacks performance and improved beverage volumes in Europe and Americas were probably the reasons for the beat. However, it was adverse currency translation which weighed on total revenue growth as currency concerns ate away 6% revenue growth. Pepsi now expects core constant currency earnings per share to increase 7% in 2015, in tune with the long-term management goal of high single-digit core constant currency earnings growth. Notably, currency is expected to mar both earnings per share and revenues by 7% in 2015. Thanks to upbeat earnings, the PepsiCo stock was up about 2.5% in the key trading session of February 11. Coca-Cola Too Posts Decent Earnings On February 10, Coca-Cola reported adjusted earnings of $0.44 per share in Q4 which beat the Zacks Consensus Estimate by around 5%. Earnings declined 5% year over year thanks to a stronger dollar, which was up 5% on a constant currency basis, driven by improved organic revenues and cost-cutting efforts. Net revenue slipped 2% year over year to $10.87 billion due to headwinds from currency and structural changes. Excluding these effects, constant currency revenues grew 4% in the quarter. The best part is that revenues beat the Zacks Consensus Estimate of $10.77 billion by 1%. An extra selling day, better sparkling beverage performance, strong price/mix gains and volume growth in North America helped the company to hold gains. Management remains hopeful about its 2015 operations and sees this as a transition year. However, foreign exchange is expected to hurt 2015 revenues by 5% and profit before tax by 7-8%. While an overall beat offered the KO stock about 2.8% gains in the key trading session of February 10, its shares retreated about 0.1% on February 11. ETF Impact The beverage earnings also put in focus several consumer staples ETFs having notable exposure to Coca Cola and PepsiCo. Funds like Consumer Staples Select Sector SPDR ETF (NYSEARCA: XLP ) , Vanguard Consumer Staples ETF (NYSEARCA: VDC ) and iShares Dow Jones U.S. Consumer Goods Sector ETF (NYSEARCA: IYK ) have large allocations in KO and PEP. Below, we have highlighted these funds in detail: XLP in Focus The most popular consumer ETF in the market, XLP follows the S&P Consumer Staples Select Sector Index. The fund invests about $10.2 billion of assets in 41 holdings. Of these firms, the in-focus Coca-Cola takes the second spot, making up roughly 9.21% of the assets while PepsiCo accounts for about 4.63% of XLP taking up the seventh position. The fund charges 15 bps in fees per year from investors. The fund has added about 1.6% (as of February 11, 2015) post KO earnings. XLP currently has a Zacks ETF Rank #3 (Hold) with a ‘Medium’ risk outlook. VDC in Focus This fund manages a $2.61 billion asset base and provides exposure to a basket of 100 consumer stocks by tracking the MSCI U.S. Investable Market Consumer Staples 25/50 Index. The product charges a low fee of 12 bps per year from investors. Again here, Coca-Cola is the second firm with 8.0% allocation and PepsiCo is the third firm holding 6.7%. The product is widely spread across various sectors out of which soft drinks have a 17.1% allocation. VDC added about 1.6% (as of February 11) within the last two days. VDC currently has a Zacks ETF Rank #3 with a ‘Medium’ risk outlook. IYK in Focus This ETF tracks the Dow Jones U.S. Consumer Goods Index, giving investors exposure to the broad consumer staples space. The fund holds about 115 stocks in its basket with AUM of $516 million, while charging a slightly higher fee of 43 bps per year from investors. Coca-Cola and PepsiCo occupy the second and third positions respectively in the basket with 7.87% and 6.91% of assets. The fund was up 1.63% (As of February 11) post the duo’s earnings. The product has a Zacks ETF Rank #3 with a ‘Medium’ risk outlook. Bottom Line Though the beverage giants ended 2014 with an overall beat and started off 2015 on a refreshing note, currency concerns might surface this year. Plus, the industry fundamentals are also not great as it falls in the bottom 29% section of Zacks Industry Ranks. So, investors having high hopes on the duo might bet on these beverage giants through a basket approach as it partly shields the risk of single-stock investing.