Sabesp: High Risk, Less Reward
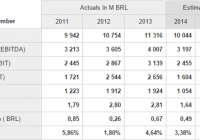
Summary Continued drought and weakening of the BRL exposes currency bet gone wrong. New Chief Executive Officer faces tough choices and will most likely have to cut the dividend. Long-term dividend may suffer from increased investment needs. About Sabesp ( SBS ), Companhia de Saneamento Basico do Estado de Sao Paulo, is a Brazilian waste management company – majority owned by the state of Sao Paulo (50.3%), 25.5% are traded on the Novo Mercado in Brazil, and roughly 24.2% are traded on NYSE. Sabesp is one of the largest waste management companies in the world. The share price has fallen significantly in the last 2 years. This is mainly due to the deteriorating profitability and increased financial leverage caused by the worst drought in Brazil in over 80 years. Consensus forecast From 4-traders . (click to enlarge) I believe that due to the continued drought and the weakening of the BRL, the earnings and dividend estimates may have to be reduced further. Seems like only rain can keep estimates from falling. My forecast I have made a forecast for Sabesp primarily based on their Q3 2014 report and presentation. To make the forecast and charts I have used the Corporate Risk Model from Simulationfinance.com . (click to enlarge) I have assumed a total start volume (water and sewage) of 889.4 million m3, equal to the report volume in Q3 2014. The average price of 3.17 is calculated as total revenues in Q3 2014 divided by total volume. The cost of goods sold is calculated as 2.34 – total operating costs in Q3 2014 divided by total volume. I have assumed quarterly volume growth of 1%, about the same as quarterly increase in connections. The price and costs per volume normally roughly follow the inflation rate in Brazil. Currently, the inflation rate in Brazil is about 7% . I have for simplicity assumed a flat 1% quarterly increase in prices, assuming that the inflation in Brazil levels off. I have assumed that costs per volume only increases by 0.5% per quarter. This leads to the EBITDA margin to increase from the current about 26% to about 30%. The below chart shows the historical EBITDA margin as presented by the company in their Q3 2014 report. Based on reported historical data since Q1 2012, the quarterly standard deviation in total volume has been about 3.1%. The estimated average price per total volume standard deviation has been about 7.5%. The estimated average cost per total volume standard deviation has been about 11.5%. These high standard deviations are influenced by the recent drought. In this analysis, I assume that future volatility will be somewhat lower. I assume that going forward the quarterly standard deviation for volume is 3%, for the price per volume the quarterly standard deviation is 4%, and for the costs per volume the quarterly standard deviation is 5%. Confidence analysis The below chart shows the calculated possible total volume development with included risk assumptions. (click to enlarge) The black dotted line shows the base case total quarterly forecast. Total volume is expected to grow from about 890 million m3 in Q3 2014 to about 1000 million m3 in Q4 2017. The darkest blue area shows the range that contains 75% of the calculated outcomes based on my assumption that volume has a quarterly standard deviation of 3%. The second blue area, together with the darkest blue area contains 90% of the calculated outcomes. The total blue area contains 95% of the calculated outcomes. 2.5% of the calculated outcomes are above the blue area and 2.5% of the calculated outcomes are below the blue area. The quarterly volume at the end of 2017 is calculated to be roughly between 800 million m3 and 1250 million m3. The below chart shows the calculated possible revenue development with included risk assumptions. (click to enlarge) The below chart shows the calculated possible EBITDA development. (click to enlarge) The below chart shows the calculated possible EBITDA margin development. (click to enlarge) Financial leverage From the 2013 annual report: The financial covenants related to AB Loan agreements (1983AB) consider the Company’s ratio of debt service coverage, which must be higher than or equal to 2.35:1.00; and the total adjusted debt over EBITDA, determined on a consolidated basis, which must be lower than or equal to 3.65:1.00. This agreement has a cross-default clause. See Note 15 of our Financial Statements. Report . The below chart from the Q3 2014 presentation shows the quarterly historic development in the gross debt to adjusted EBITDA ratio. The below chart from the Q3 2014 presentation shows the currency breakdown of the debt. In Q3 2014, Sabesp lost about R$300 million on exchange rate variation on their foreign currency loans. Due to continued weakening of the BRL in the fourth quarter of 2014, the losses may be about the same in Q4 2014. At the current exchange rate of about 2.85 BRL per USD, the loss in Q1 2015 looks set to also be around R$300 million. If cash is unchanged and this happens then the total debt could be about R$10.650 million at the end of Q4 2014 and R$11.000 million at the end of Q1 2015. Assuming adjusted EBITDA in Q4 2014 and Q1 2015 is R$742 million, the same as in Q3 2014, then gross debt/adjusted EBITDA could reach about 3.35 at the end of 2014 and about 3.8 at the end of Q1 2015. In order for the ratio to be below 3.5 at the end of Q1 2015 in this example, the cash reserves must be more than halved from current levels of about R$1.800. The loan covenant says that this ratio must be lower than or equal to 3.65. Regulation may also prohibit the company to pass on these currency losses to tariffs. Therefore, I assume that there will not be any dividend paid in 2015 (most likely there will be a small dividend), but that the company will have a dividend payout ratio of 35% in 2016 and onwards. The below chart shows the quarterly historic development in the gross debt to EBITDA ratio and the quarterly calculated possible development assuming that cash is unchanged, gross debt increases with R$350 million in both Q4 2014 and Q1 2015. (click to enlarge) Valuation multiples The below chart shows the quarterly calculated possible development in earnings per share including the assumed exchange variation cost in Q4 2014 and Q1 2015. (click to enlarge) The below chart shows the base case expected earnings per share and dividend per share based on all the assumptions. (click to enlarge) The below chart shows the current share price (about BRL 14) divided by base case yearly earnings per share. (click to enlarge) The below chart shows the current share price divided by base case assumed future book equity per share. (click to enlarge) The below chart shows assumed future earnings per share divided by the share price (earnings yield) and the assumed future dividends per share divided by the share price (dividend yield) . (click to enlarge) Valuation Based on the dividend growth model, assuming a cost of capital of 10% and perpetual growth in dividend from 2017 of 4%. Alternative 1 : Volume and prices have an expected quarterly change of 1% whereas Costs have an expected quarterly change of only 0.5%. This implies that the EBITDA margin increases from currently at about 26% to about 30% at the end of 2017. (click to enlarge) The distribution chart shows the distribution of valuations per share based on all the assumptions made. The horizontal axis shows the distribution of calculated fair value per share, and the vertical axis shows the calculated probability of each outcome. The percentage shown on each bar is the accumulated probability, starting from the left. The chart shows that based on all the assumptions made, there is an estimated 76.7% probability that the fair value per share is below BRL 13.2 ($4.6). Current share price is about BRL 14 ($5). Alternative 2 : Volume, prices and costs all have an expected quarterly change of 1%. This implies that the EBITDA margin is constant at current level of about 26%. (click to enlarge) The chart above shows that based on these assumptions there is an estimated 74.9% probability that the fair value per share is below BRL 10.8 ($4.6). Current share price is about BRL 14 ($3.8). Share price The below chart shows the share price history in the last 50 trading days and the possible outcomes in the next 10 trading days based on the historic share price changes the last 12 months. Source: Portfolio Model Free . (click to enlarge) The below chart shows the dispersion of possible share prices in 10 trading days from now based on the historic share price changes the last 12 months. This analysis implies that there is a 53.6% probability that the share price will be below $4.96 in 10 trading days from now. (click to enlarge) Conclusion Sabesp is an interesting long-term growth company, but short-term financial leverage issues and state majority ownership makes it a very risky investment. My guess is that the dividend has to be cut significantly. There may also be reduced longer-term opportunity in the share price as the company may be forced to increase investments in order to reduce the possibility of another water shortage in the future. The new Chief Executive Officer may announce drastic measures that can create an interesting investment opportunity, but I would not bet that the immediate effect will be positive for the share price. Disclosure: The author has no positions in any stocks mentioned, and no plans to initiate any positions within the next 72 hours. (More…) The author wrote this article themselves, and it expresses their own opinions. The author is not receiving compensation for it (other than from Seeking Alpha). The author has no business relationship with any company whose stock is mentioned in this article.