Tag Archives: income

Structured Notes: Read The Fine Print
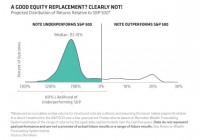
By Seth J. Masters, Richard Weaver, John McLaughlin Structured notes have gained in popularity, but investors would be wise to read the fine print carefully. Our research indicates that these complex instruments rarely live up to their intriguing claims. Nearly $13 billion of structured notes were sold by banks in the first quarter of 2015-more than in any quarter since early 2011. It’s easy to see why. Who wouldn’t like to participate in the equity market’s upside, while protecting their portfolio from potential losses? Unfortunately, our research shows that structured notes seldom deliver the promising outcomes touted in their bold headlines. Structured notes come in many flavors, and we analyzed the claims of several of the more popular varieties. Our analysis found that an oversimplified pitch typically obscures key constraints that adversely impact the investor’s likely final payout. Give with the Left, Take with the Right Consider a recent five-year structured note tied to the broad market that promises the price return of the S&P 500 Index but no loss on the first 28% cumulative drop. Buried in the disclosure are important caveats, including the lack of dividends or yield, plus a five-year waiting period for any distributions. Those who skip the fine print might be tempted to consider this note as a potential replacement for direct stock exposure. In our view, that would be a mistake. Our analysis suggests that this structured note has an 80% chance of underperforming the S&P 500 over the next five years-and by no small amount. Using our Capital Markets Engine, we estimate the median return that investors would forego at just over 12%, as the Display below shows.  A closer look under the hood reveals why. To achieve the optimal balance between upside and downside, banks package a zero-coupon bond with options on the S&P 500. In addition to markups on the embedded bond and options, there’s a healthy sales commission, all of which reduce investors’ return potential. Tying the note to the S&P 500’s price return-as opposed to the total return you’d receive through an S&P 500 index fund or ETF-is another drawback. The index fund includes dividends, which have historically been a meaningful portion of the broad market’s overall gains. Missing out on dividends for five years puts the note at a distinct disadvantage. It explains the lion’s share of the performance gap. Settling for Less Given the structured note’s mix of growth and protection, some might consider a balanced portfolio that includes globally diversified equities, municipal bonds and other diversifiers a more relevant comparison. Here again, the structured note falls short. Projecting thousands of plausible outcomes across all types of market environments, we found that the median outcome for the structured note is more than 6% below what we’d expect from a fully diversified balanced portfolio, as the next Display shows. Given the sales pitch, you might expect the structured note to do better if the S&P 500 price declines over five years. Not so! In down markets, the structured note would protect you from losses up to 28%, but your expected return would be zero. By comparison, we forecast that a balanced portfolio that includes bonds and other diversifiers would have an expected return of 4.5%, with better downside protection from a deeper market drop. That’s because the income from bonds-along with their tendency to move in the opposite direction from equities-can help offset the losses from stocks, while alternatives act as a further diversifier. In short, if investors are willing to accept no return, they are setting the bar too low. For most investors, an income-generating balanced portfolio that is both liquid and likelier to outperform represents a much better solution. When it comes to structured notes, investors need to make sure they’re getting the full picture from their provider. The views expressed herein do not constitute research, investment advice or trade recommendations and do not necessarily represent the views of all AB portfolio-management teams. The Bernstein Wealth Forecasting System uses a Monte Carlo model that simulates 10,000 plausible paths of return for each asset class and inflation and produces a probability distribution of outcomes. The model does not draw randomly from a set of historical returns to produce estimates for the future. Instead, the forecasts (1) are based on the building blocks of asset returns, such as inflation, yields, yield spreads, stock earnings and price multiples; (2) incorporate the linkages that exist among the returns of various asset classes; (3) take into account current market conditions at the beginning of the analysis; and (4) factor in a reasonable degree of randomness and unpredictability.
ONEOK Continues To Be Dragged Down By Its MLP

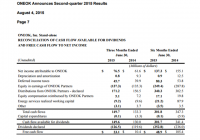
Summary ONEOK reports its Q2 2015 results. Numbers were inline with guidance. However, the stock still fell on the news. ONEOK will not recover until its MLP ONEOK Partners achieves sustainable levels of cash flows. As a holder of several large cap midstream MLPs and General Partners, the performance of ONEOK, Inc (NYSE: OKE ) has been extremely disappointing. When I bought the stock, it had just provided some very bullish Increase guidance for 2015 . Yet, due to the collapse seen in commodity prices late last year, the company slashed its dividend growth estimates considerably. Add to that the general market sell off, ONEOK has been a house of pain to hold. Last week, ONEOK reported its Q2 2015 results. All things considered, these were strong numbers. Net income was $76.5M, up 24% from $61.6M last year. On a per share level, net income was $0.36, up a similar 24% from $0.29 per share last year. Distributions declared from ONEOK Partners (NYSE: OKS ), which constitute the vast majority of ONEOK’s cash flows, were $171.2M, up 9% from $156.5M last year. As for Cash flow available for dividends, this key metric was $149.6M, up 15% from $130.0M last year. This left ~$23M in excess cash flow and resulted in a strong 1.18x dividend coverage ratio, versus ~$11M in excess cash flow and 1.09x coverage last year. (click to enlarge) Guidance remains unchanged As for ONEOK’s guidance, not much has changed. The company expects cash flow available for dividends to range from $570M to $650M (~$153M per quarter), and excess cash flows to range from $90M to $120M (~$26M per quarter). Given these are close to the numbers posted for the first half, this guidance does not seem very hard to achieve. Results from ONEOK Partners need to improve ASAP While ONEOK numbers were good, the same could not be said for the MLP ONEOK Partners. This is important given that the vast majority of ONEOK’s cash flows come from this unit. For the quarter, ONEOK Partners posted $387.3M in adjusted EBITDA, a key metric for profitability in MLPs, $276.9M in DCF, and a 0.88x coverage ratio. This compares to adjusted EBITDA of $360.9M, DCF of $272M, and a coverage ratio of 1.02x, last year. In other words, ONEOK Partners did not fully cover its distribution in Q2 2015, though it did see an improvement from the 0.60x coverage ratio for Q1 2015. This shortfall is largely a result of weak commodity price, mainly NGLs and natural gas. While the revenues for the MLP are mostly fee-based, the commodity margin based contracts have taken a beating, resulting in much weaker profits. ONEOK Partners is trying to grow its way out of its problem, hoping to expand volumes on its systems by bringing online flare gas and adding processing and gathering capacity to underserved fields. However, in order to grow, ONEOK Partners needs to spend money on its capital programs. This has forced the company to issue units via its ATM program, selling 5.5M units for $208.1M in the quarter. With the yield above 10%, this is some very expensive capital to raise. Nevertheless, ONEOK Partners is expecting its adjusted EBITDA to tick higher in the next few quarters, with the guidance range for the full year reaffirmed at $1.51B to $1.73B, or a midpoint of ~$405M per quarter, up 5% from the Q2 numbers. Assuming a similar DCF to adjusted EBITDA ratio, this increase should put the company closer to a 1.00x coverage ratio. Conclusion While the numbers from ONEOK were strong, ONEOK Partners is the reason the stock is not trading higher. As long as the MLP remains underwater with its distribution, the market will continue to price both with additional risk as shown by the near 7% yield for ONEOK and 10% yield for ONEOK Partners. One way ONEOK could solve its problems is via a consolidation similar to that of Kinder Morgan (NYSE: KMI ) or Williams Companies (NYSE: WMB ) (NYSE: WPZ ). However, I do not see a move like this coming anytime soon given the weak commodity price environment. Disclaimer: The opinions in this article are for informational purposes only and should not be construed as a recommendation to buy or sell the stocks mentioned. Please do your own due diligence before making any investment decision. Disclosure: I am/we are long OKE, OKS, WMB, KMI. (More…) I wrote this article myself, and it expresses my own opinions. I am not receiving compensation for it (other than from Seeking Alpha). I have no business relationship with any company whose stock is mentioned in this article.

Dividend Growth Stock Overview: American States Water Company

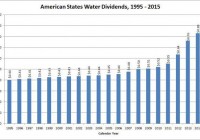
About American States Water Company American States Water Company (NYSE: AWR ) has subsidiaries that provide utility services to portions of 10 counties in southern California, and to military bases in certain parts of the United States. The company has its headquarters in San Dimas, California, and employs over 700 people. Through its Golden State Water Company (GSWC) subsidiary, American States provide water and wastewater services to 75 communities in California, and electric services to the city of Big Bear Lake and portions of San Bernardino County in southern California. GSWC was incorporated in California in 1929, and at the end of 2014, served over 250,000 water utility customers and 23,000 electric customers. The American States Utility Services subsidiary provides water and wastewater services to various military installations through its subsidiaries. The subsidiaries are on 50-year firm, fixed-price contracts with the government; the contract prices are subject to redetermination every 3 years. The military installations include Fort Bliss, TX; Andrews AFB, MD; Fort Lee, Fort Eustis, Fort Story, VA; Fort Jackson, SC; and Fort Bragg, Pope Army Airfield and Camp Mackall, NC. American States Water has three reportable segments: water utilities, electric utilities and contracted services. In 2014, 74% of the company’s EPS came from the water utilities segment, 4% came from the electric utilities segment and 20% came from the contracted services segment. (The remaining 2% came from other earnings, like earned interest.) In 2014, American States Water earned $61.1 million of income on $466 million. These numbers were each down less than 3% from 2013’s figures, but income was up more than 12% from 2012. EPS in 2014 was $1.57, down 2.5% from 2013. Given the current annualized dividend rate of 89.6 cents a share, the company’s current payout ratio is 57.1%. In addition to the annual dividend, American States Water also has an active share repurchase program. In March 2014, the company authorized the repurchase of 1.25 million shares, to be completed by June 30, 2016. By the end of 2014, there were 705,000 shares remaining to be repurchased. The company is a member of the S&P Small Cap 600 and Russell 2000 Small Cap indices, and trades under the ticker symbol AWR. American States Water Company’s Dividend and Stock Split History (click to enlarge) American States Water has accelerated its dividend growth recently, compounding its dividend at a rate of nearly 11% over the last 5 years. American States Water Company has paid dividends every year since 1931, and has increased them since 1955. Until 2012, the company would increase dividends on an irregular schedule, sometimes going up to 8 quarters without an increase. (Because the dividend increases occurred in the middle of the year, they still increased year-over-year.) In 2012, American States began to increase the dividend in the 3rd quarter of the calendar year, with the stock going ex-dividend in mid-August. Most recently, the company increased its dividend by 5.41% to an annualized rate of 89.6 cents. I expect American States to increase its dividend for the 62nd consecutive year in mid-August 2016. Since introducing the regular pattern of increasing dividends annually in the 3rd quarter, the company has grown dividends very nicely for a utility. Dividend growth from 2011 to 2012 and 2012 to 2013 exceeded 15% each year. Prior to 2012, the dividend growth was very sluggish and usually in the low-single digits. Over the 5 years ending in 2014, American States compounded its dividend at a rate of 10.92%. For the 10 and 20 years ending in 2014, the company compounded its dividends at 6.85% and 3.96%, respectively. In the last 25 years, the company has split its stock 3 times, most recently 2-for-1 in September 2013. American States Water also split its stock in October 1992 (2-for-4) and June 2002 (3-for-2). For each share of American States Water stock purchased prior to October 1993, you would now have 6 shares. Over the 5 years ending on December 31, 2014, the stock appreciated at an annualized rate of 19.79%, from a split-adjusted $15.10 to $37.25. This greatly outperformed the 13.0% annualized return of the S&P 500 index, the 15.9% annualized return of the S&P Small Cap 600 index and the 14.0% compounded return of the Russell 2000 Small Cap index over the same period. American States Water Company’s Direct Purchase and Dividend Reinvestment Plans American States has both direct purchase and dividend reinvestment plans. You do not need to be a current investor to participate in the plans. New investors can join by purchasing a minimum of $500 of American States Water stock upon enrollment. Note that you’ll be charged an enrollment fee of $10 to join. Also, the dividend reinvestment plan can be used only if you agree to reinvest dividend on at least 15 shares of the stock. If you own less than 15 shares, your dividends will be paid to you by check. If you already participate in the dividend reinvestment plan, you can purchase additional shares with a minimum investment of $100. The plans’ fee structures are favorable for investors, with the company picking up all costs on stock purchases. When you sell your shares, you’ll pay a transaction fee of $15, plus a sales commission of 12 cents per share. All fees are deducted from the sales proceeds. Helpful Links American States Water Company’s Investor Relations Website Current quote and financial summary for American States Water Company (finviz.com) Information on the direct purchase and dividend reinvestment plans for American States Water Company Disclosure: I do not currently have, nor do I plan to take positions in AWR.