Tag Archives: income

Want To Invest In Gold? Here Are The Best Funds
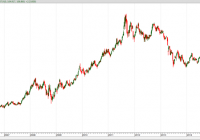
Summary Bullion funds have offered better risk-adjusted returns than mining stock funds and bullion has also been less volatile. Silver has been significantly more volatile than gold in both bull and bear markets. ETFs have generally provided better risk-adjusted performance than CEFs. Precious metal funds have provided excellent diversification for an equity portfolio that mimics the S&P 500. I am primarily an income investor but I have a contrarian streak and believe in the wisdom of Warren Buffett when he opined: “Be greedy when others are fearful.” In a previous article , I applied this advice to energy funds but it is also true for gold and precious metal funds. Gold has been in a sustained bear market since 2011 and prices have plummeted from over $1900 an ounce to less than $1100 an ounce. This has driven down precious metal funds to what I consider bargain basement levels. The rapid fall of gold is illustrated in Figure 1, which plots the price of the SPDR Gold Trust ETF (NYSEARCA: GLD ) . This fund was launched in 2004 and is the oldest and one of the most liquid precious metal ETFs (average volume over 6 million shares per day). One share represents a tenth of an ounce of gold. The gold backing this ETF is held in vaults in London. Gains from this ETF are taxed like you owned the physical gold directly (taxed at collectibles rate if you hold for more than a year). It has an expense ratio of 0.4% and does not provide any yield. The plot shows that GLD has fallen over 37% since peaking in September, 2011. (click to enlarge) Figure 1: Plot of GLD since 2007 I am not clairvoyant and have no idea how long it will take the precious metal sector to recover. However, I am confident that over the long run, gold will again return to its glory days. This is based on past history coupled with the likely fall of fiat currencies due to rampant deficit spending. So personally, I have begun accumulating beaten-down precious metal funds. This article will analyze the risk versus reward of these funds to answer several questions: Is it better to invest in bullion or mining stocks? Is it better to invest in ETFs or Closed End Funds ? Is it better to invest in gold or silver? Do precious metals offer diversification for an equity portfolio? There are many ways to define “better”. Some investors may use total return as a metric, but as a retiree, risk in as important to me as return. Therefore, I define “better” as the fund that provides the most reward for a given level of risk and I measure risk by the volatility. Please note that I am not advocating that this is the way everyone should define “better”. I am just saying that this is the definition that works for me. There are a number of ETFs and CEFs that focus on gold and silver. For this analysis, I chose representatives that have at least a history that includes October, 2007 (the start of the equity bear market) and were reasonably liquid. These selections are summarized below. Exchange Traded Funds GLD. This ETF has already been described. Note that the iShares Gold Trust ETF (NYSEARCA: IAU ) and the PowerShares DB Gold ETF (NYSEARCA: DGL ) are highly correlated (over 99%) with GLD and will not be included in the analysis. iShares Silver Trust ETF (NYSEARCA: SLV ). One share of this ETF tracks the price of one ounce of silver bullion. The shares are backed by silver held in banks in London and New York. Silver is more volatile than gold, primarily because it is sensitive to industrial demand in addition to being a “safe haven” asset. This is not all bad since the industrial uses may serve to support prices if the desire for silver wanes among investors. This fund is very liquid (average 7 million shares per day) and has an expense ratio of 0.5%. It does not have any yield. Like GLD, gains from SLV are taxed as collectibles. PowerShares DB Precious Metals ETF (NYSEARCA: DBP ). Rather than holding physical bullion, this ETF is rule based and invests in both gold (80%) and silver (20%) future contracts. With the focus on gold, it is highly correlated (97%) with GLD. The fund has an expense ratio of 0.75% and does not have any yield. Market Vectors Gold Miners ETF (NYSEARCA: GDX ). This ETF holds 43 cap-weighted precious metal mining companies (mostly gold miners but a few silver miners). About 56% of the assets are Canadian companies with the rest primarily in the U.S., South Africa, and Australia. It is extremely liquid (over 45 million shares per day) and has a reasonable expense ratio of 0.53%. It has a small yield of 0.9%. Closed End Funds Central Gold Trust (NYSEMKT: GTU ). This CEF seeks to replicate the performance of gold bullion. It holds gold bullion at the Canadian Imperial Bank of Commerce and does not lease out gold. One of the main differences between GTU and GLD is that GTU is a CEF that can sell at a premium or discount. Currently, this fund is selling at a 6 discount! During past bull markets, this fund has sold for a 10% premium so the price of the fund fluctuates more than GLD, but there also is the potential of higher returns. This fund does not use leverage and has an expense ratio of 0.4%. It does not pay any distribution. Central Fund of Canada (NYSEMKT: CEF ). This is a closed-end fund that holds roughly 50% gold bullion and 50% silver bullion. As a closed-end fund, it can sell at a premium or discount to Net Asset Value (NAV). During the heyday of the precious metal frenzy, the fund sold at a 15% premium. It currently sells at a 10.9% discount, which is historically low. Over the past 5 years, the average discount has been only 0.6%. This fund does not use leverage and has a low expense ratio of 0.3%. It is relatively liquid for a closed-end fund, trading about 700,000 shares per day. For tax purposes, this fund is a passive foreign investment company so you should consult your tax advisor relative to the treatment of gains and losses. Note that the symbol for this fund is the same as the abbreviation used to indicate closed-end funds, but the context should make the meaning clear. ASA Gold and Precious Metal (NYSE: ASA ). This CEF sells at a 1.4% discount, which is lower than the 5 year average discount of 7.6%. The portfolio consists of 40 miners, with 47% from Canada, 20% from the United States, 10% from the Channel Islands, and 9% from South Africa. About 77% of the portfolio are mining companies with the rest royalty and development companies. The fund does not use leverage and has an expense ratio of 0.8%. The distribution is 0.5%. GAMCO Global Gold, Natural Resources and Income Trust (NYSEMKT: GGN ). This is a closed-end fund that writes options on gold and natural resources stocks. It uses a small amount of leverage (10%) and has an expense ratio of 1.3%. However, it currently is distributing a huge 15.1%, but most has come from return of capital (ROC). The Undistributed Net Investment Income (UNII) is near zero, which is not bad. It is selling at a 14.3% discount, which is unusual since over the past 5 years it has sold at an average premium of 0.8%. It has 112 holdings, primarily precious metal companies, but some oil and other resource stocks. Essentially all of the holdings are from North American firms. To analyze risks and return associated with these funds, I used a look-back period form October 12, 2007 (the stock market high before the 2008 bear market) to the August 12, 2015. This provides a view of how these funds fared over the bear-bull cycle of the stock market. The results are shown in Figure 2, which provides the rate of return in excess of the risk free rate of return (called Excess Mu on the charts) plotted against the historical volatility. The risk-free rate was assumed to be 1%. (click to enlarge) Figure 2. Risk versus reward since October, 2007 As is evident from the figure, there was a relatively large range of returns and volatilities. For example, SLV had a high rate of return but also had high volatility. Was the increased return worth the increased volatility? To answer this question, I calculated the Sharpe Ratio. The Sharpe Ratio is a metric developed by Nobel laureate William Sharpe that measures risk-adjusted performance. It is calculated as the ratio of the excess return over the volatility. This reward-to-risk ratio (assuming that risk is measured by volatility) is a good way to compare peers to assess if higher returns are due to superior investment performance or from taking additional risk. In Figure 2, I plotted a red line that represents the Sharpe Ratio associated with GLD. If an asset is above the line, it has a higher Sharpe Ratio than GLD. Conversely, if an asset is below the line, the reward-to-risk is worse than GLD. Some interesting observations are evident from the figure. Bullion funds easily outperformed mining stock funds. The mining stock funds had negative returns over the observation period and were also very volatile. Not a good combination. Gold bullion had the lowest volatility. The combination of relatively good return and low volatility resulted in GLD having the best risk-adjusted performance. GTU had higher volatility than GLD but also higher absolute return. As previously discussed, this is likely due to the nature of closed-end funds. However, on a risk-adjusted basis, the performance of GTU slightly lagged GLD. SLV was significantly more volatile than gold funds and the volatility was not offset by higher return. Hence, the risk-adjusted performance of silver lagged gold. Generally, CEFs were more volatile than ETFs. One of the worst performers was ASA. It had a negative return coupled with a relatively high volatility. One of the reasons many pundits recommend that people allocate a portion of their portfolio to precious metal is because they are a “diversifier”. To be “diversified,” you want to choose assets such that when some assets are down, others are up. In mathematical terms, you want to select assets that are uncorrelated (or at least not highly correlated) with each other. To check out if these funds do, in fact, provide diversification, I calculated the correlation matrix. I also included the SPDR S&P 500 Trust ETF (NYSEARCA: SPY ) for reference. The results are shown in Figure 3 for over the past 3 years. As you would expect, the funds are moderately to highly correlated with one another but were virtually uncorrelated with SPY. So if you have an equity portfolio that mimics the S&P 500, using precious metal funds does provide excellent diversification. (click to enlarge) Figure 3. Correlation matrix since October, 2007. Figure 2 showed how these funds have performed in the past. However, the real question is how they will perform in the future when the bull market in precious metal returns. Of course, no one knows what will happen but we can obtain some insight by looking at the most recent bull market period from October, 2007 to September 2011. As shown in Figure 1, this was a great period for gold. Figure 4 plots the risk versus reward for the funds over this bull market time frame. (click to enlarge) Figure 4. Risk versus reward during a bull market This plot shows: Bullion funds performed much better than the mining stock funds in both absolute and risk-adjusted return. This was surprising since mining stocks are often touted as being the best investment during a bull market. GLD continued to be the best performer on a risk-adjusted basis. It also had the lowest volatility. SLV excelled on absolute basis but also had higher volatility than GLD. Thus, silver lagged on a risk-adjusted basis. For the mining stocks, GDX outperformed both ASA and GGN. GBP and GTU booked performance that was close to GLD. The last year of the gold bull market had some spectacular gains and enticed fund companies to launch several new precious metal funds. Some of the new ETFs that were launched between 2009 and 2010 are summarized below. ETFS Physical Platinum Shares ETF (NYSEARCA: PPLT ). Platinum is used primarily in industrial applications and jewelry, rather than being held as a hedge against fiat currency. It is rarer than gold and the price is usually, but not always, higher than gold. A primary use of platinum is in automobile catalytic converters, but it also has a wide demand in jewelry, especially when the price falls below gold. One share of PPLT represents about a tenth of an ounce of platinum. It is not nearly as liquid as other precious metal ETFs (trading only about 35,000 shares per day). The ETF holds bullion in banks in London and Zurich. Like the other precious metal ETFs, gains are taxed as collectibles. The fund has an expense ratio of 0.60%. ETFS Physical Palladium Shares ETF (NYSEARCA: PALL ). Palladium is a lesser known precious metal that can be used instead of platinum in catalytic converters and in jewelry. It has many of the same properties as other precious metals in that it is malleable, easy to polish and remains tarnish free. In Europe, 15% palladium is typically alloyed with gold to produce “white gold”. Palladium is used primarily for industrial applications and is generally not considered a “safe haven” asset. Each share of PALL represents about a tenth of an ounce of Palladium. The ETF trades an average of 40,000 shares per day so it is relatively liquid. The bullion associated with the ETF is stored in vaults in London and Zurich. The fund has an expense ratio of 0.6%. Like gold and silver, it is taxed like collectibles. Global X Silver Miners ETF (NYSEARCA: SIL ). This ETF holds 25 cap-weighted silver mining companies. Almost 60% of the constituents are based in Canada and the rest are spread primarily among the United States, Europe, and Latin America. It is relatively liquid (trading about 250,000 shares per day) and has an expense ratio of 0.65%. The fund has a small yield of 0.1%. Market Vectors Junior Gold Miners ETF (NYSEARCA: GDXJ ). This ETF focuses on the junior gold and silver miners. The fund holds 63 miners, some of which have not yet begun to generate revenue. The coupling of small-cap with miners creates a very volatile fund that has the potential for large losses as well as large gains. This is a popular ETF, trading over 9 million shares per day on average. The expense ratio is 0.55% and yield 0.9%. The Risk-Reward plot for the last 17 months of the bull market (April, 2010 to September, 2011) is shown in Figure 5. This is a relatively short period of time so caution is advised when drawing longer term conclusions. However, overall this plot is similar to Figure 2 but also provides a relative assessment of the new ETFs. GLD still leads the pack with DBP, GTU, and SLV close behind. PPLT and GGN did not perform well and barely eked out a positive return. For the most part, bullion outperformed the miners but GDXJ generated a good return but also had very high volatility. (click to enlarge) Figure 5. Risk versus reward for last 17 months of bull market Bottom Line From being the darling of the investment world to one of the most hated asset classes, precious metals have come a full circle… There are no guarantees, but based on the amount of money being printed and the trouble spots around the globe, I think investors will migrate back to gold as a safe haven and an (eventual) inflation hedge. Whether or not you have precious metals in your portfolio is a personal decision. However, if you decide to allocate some of your resources to this asset class, then based on past data here are answers to the questions I posed at the beginning of the article. Is it better to invest in bullion or mining stocks? Bullion has consistently outperformed mining stocks. I know that many investors are wary of GLD but it has been a consistent outperformer on a risk-adjusted basis so it is one of my recommendations. Is it better to invest in ETFs or CEFs ? ETFs have outperformed CEFs. However, for gold, GTU has close to the same performance as GLD. If you want to add mining stocks, GDX appears to be the best choice. Is it better to invest in gold or silver? It depends on your risk tolerance and investment objectives. Silver typically has high returns but much higher volatility than gold. On a risk-adjusted basis, gold is the winner. Do precious metals offer diversification for an equity portfolio? Definitely yes. Precious metals are not highly correlated with equities. Even mining stocks offer significant diversification with respect to other types of equities. Disclosure: I am/we are long GTU,GLD,CEF,GDX,GDXJ, SIL. (More…) I wrote this article myself, and it expresses my own opinions. I am not receiving compensation for it (other than from Seeking Alpha). I have no business relationship with any company whose stock is mentioned in this article.
MORL: Twice The Risk For Not A Lot Of Fun

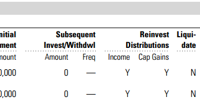
Summary MORL is an exchange traded note offered by UBS benchmarked to 2x the Market Vectors Global Mortgage REITs Index. The Market Vectors® Global Mortgage REITs Index is a float-adjusted, market capitalization weighted index designed to measure the performance of publicly-traded mortgage REITs. The index covers 90% the of mortgage REITs. Even though the MORL currently yields an attractive 26% distribution, it has lost significant value since inception, and last year in particular. When we meet with prospective clients, one of the questions we ask is how they have chosen their existing investments, in particular for their retirement accounts. Quite often, especially with do-it-yourself type investors, we will get two answers that make our ears cringe; 1. choosing the funds that have gained the most in the prior year, and 2. choosing the investments that yield the highest dividend or distribution. For anyone who was looking for distributable yield in the past few years, they have most likely come across many leveraged products, including the UBS ETRACS Monthly Pay 2x Leveraged Mortgage REIT ETN (NYSEARCA: MORL ) which is currently yielding a mind-blowing 26%. Anyone who had invested in this ETN experienced a noticeable disappointment, and absolutely not the under-promise, over-deliver Starbucks (NASDAQ: SBUX ) experience many learned about and love. Let’s dig in. What is the UBS ETRACS Monthly Pay 2x Leveraged Mortgage REIT ETN? MORL is an ETN issued by UBS linked to the monthly compounded 2x leveraged performance of the Market Vectors ® Global Mortgage REITs Index (the “Index”), reduced by the accrued fees. It pays a variable monthly coupon linked to two times the cash distributions, if any, on the index constituents. About the Underlying Index The Market Vectors ® Global Mortgage REITs Index (the “Index”) is a float-adjusted, market capitalization-weighted index designed to measure the performance of publicly traded mortgage REITs. The Index provides 90% coverage of the investable mortgage REIT universe based on strict size and liquidity requirements. The Index is a price return index (i.e., the reinvestment of dividends is not reflected in the Index; rather, any cash distributions on the Index constituents, less any withholding taxes, are reflected in the variable monthly coupon that may be paid to investors of the ETN). The Index was created on August 4, 2011 and has no performance history prior to that date. The UBS ETN was launched on 10/16/2012 with an initial $25.00 per share price. The ETN has an annual expense ratio of .40%. Note: VanEck, the creator of the index also sponsors their own ETF ( Market Vectors Mortgage REIT Income ETF) following this index, trading under the ticker symbol (NYSEARCA: MORT ). It is an ETF that does not employ any leverage. Performance The premise of this product is certainly intriguing, with twice the income of an asset class that is supposed to be safer than typical equities. During times of financial stability, this works out quite well. Unfortunately, mortgage REITs like BDCs and closed-end funds get thrown out with the bathwater during sell-offs and market corrections, without regards that the underlying assets may be sound and stable. Let me explain. The problem with any pooled, daily tradable investment is liquidity. That liquidity is a benefit when you know you are able to redeem your investments any time during market hours. Unfortunately, that very same liquidity and mark-to-market accounting create issues where the underlying assets may be less liquid, such as REITs and BDCs. Liquidity is what creates the need to look at both, the market price, as well as the underlying NAV of the investment. During times of financial instability, the market price per share may be significantly below the actual underlying assets. So how has it performed so far? An issue with looking at investments that have recently launched is that unless the strategy is simply bad, or the active manager is an amateur, it was tough to lose money over the last 5 years in the market. Both MORL and MORT have launched in 2012 and 2011, respectively, so let’s start there to evaluate the performance. I first ran a Morningstar hypothetical test with a $10,000 investment in MORL and MORT, starting at their earliest common date, 10/16/2012, which is the launch date of MORL. As you can see below, if you have reinvested your distributions, a $10,000 MORL investment would be worth approximately $11,624 today. It underperformed the S&P 500 quite a bit, but at least you did not lose money. A $10,000 investment in MORT would be worth approximately $11,498. Wait… a minute. At this point you may be asking yourself… you took twice the risk for a mere $126 incremental return? Yes. Not so fun. (click to enlarge) Ok. What about if you are a typical income investor looking for income to live off of, and did not reinvest any of the distributions? That is what the second illustration is for. (click to enlarge) As you can see, a $10,000 MORL investment would now be worth approximately $6,430 on your statement. A $10,000 MORT investment would be worth a more tolerable $8,444. 2008-like account statements that you would have in 2015. Speaking of 2008, how would this portfolio have performed during that time frame? Unfortunately, none of the marketing materials from VanEck or UBS brings that up. Furthermore, many of the index constituents did not exist prior to 2009. What we do have are 3 mortgage REITs out of the index that do have a trading history. Fortunately, Annaly Capital Management (NYSE: NLY ) that makes up 17% or so of the index has a long trading history, along with MFA Financial (NYSE: MFA ) and Blackstone Mortgage Trust (NYSE: BXMT ). Together, these 3 REITs make up slightly over 25% of the index. You can see the performance of those 3 over the last 10 years below. MFA was the only one able to maintain a positive share price over a 10-year period. NLY is down approximately 32%, and BXMT imploded in 2008 and never recovered netting a 91% loss in share price. (click to enlarge) So how did they do during the peaks of the bear market? Below is a chart from Jan. 1, 2008, through November 1st, 2008: (click to enlarge) NLY suffered a 23% loss, followed by MFA with a 38.8% loss, and finally BXMT with a 72.9% fall in the share price. The thing to keep in mind is that the above are with no leverage. If you were exposed to those companies through the 2x levered UBS note, your losses would be far more severe. Bottom Line Is MORL right for you? Is it really a good product, or merely another idea thrown up in order to generate fees at the expense of foolish investors who are merely looking at yield? For an institution or an experienced professional investor, this article would likely add little that they don’t already know. Those people are also more likely to trade this product, and not invest in it. For a retail investor… listen up. MORL and perhaps even MORT are sophisticated, complex investments that cannot be just bought and forgotten about. They can hurt you very badly, very, very quickly. You must absolutely track them like a hawk with a defined exit strategy in case things go bad. A big thing to keep in mind with MORL is that it is not an exchange traded fund with underlying assets. As with other UBS ETRACS products, it is an exchange traded note, which are unsecured debt obligations of the issuer, in this case UBS AG (NYSE: UBS ). In case of default, your investment is not secured in any underlying mortgage REIT. You would be standing in line with other bondholders with a claim. Besides the zero leverage in MORT, this ETN structure is the other difference between the two products. In case VanEck has issues, your ETF is invested in the underlying mortgage REITs. I do applaud UBS as it clearly makes an attempt to point out that it is a UBS unsecured note and not an ETF on its quarterly fact sheets. The other big warning is… …Don’t Let the 2x Leverage Fool You. In reality, it is far higher. What the marketing material does not go over too well is that the underlying mortgage REITs are already heavily levered. For instance, at the end of Q4 2014, NLY was levered somewhere around 4.8x, and that was a decrease from 2013 when it was more than 6x. What this UBS ETN is doing is applying a 2x leverage multiple to an already levered asset. Remind me again, wasn’t this part of the financial collapse? Is this 2015 or are we reliving 2008 all over again here? Disclosure: I/we have no positions in any stocks mentioned, and no plans to initiate any positions within the next 72 hours. (More…) I wrote this article myself, and it expresses my own opinions. I am not receiving compensation for it (other than from Seeking Alpha). I have no business relationship with any company whose stock is mentioned in this article. Additional disclosure: None of the information discussed should be considered investment advice or a solicitation to buy or sell any securities. Please consult your investment advisor for specific recommendations.

GLDI: A Safer Way To Invest In Gold

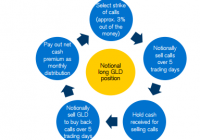
Summary GLDI is the gold variant of Credit Suisse’s covered call strategy ETNs. GLDI is an ETN issued by Credit Suisse, benchmarked to the Credit Suisse NASDAQ Gold FLOWS 103 Index, a proprietary index designed to track a covered call strategy. The Credit Suisse NASDAQ Gold FLOWS TM 103 Index notionally sells approximately 3% out of the money notional calls each month while maintaining a notional long position in GLD shares. The exchange traded note can potentially lower the downside risk over owning GLD shares or gold bullion outright with the approximately 11% distribution representing the covered call premiums. A few days ago I wrote about the silver sister product of this ETN offered by Credit Suisse. While the products are very similar in nature, there are a few differences as it relates to both the income generating strategy, and the resulting performance of the product. You can read the article about the Credit Suisse Silver Shares Covered Call ETN (NASDAQ: SLVO ) here. Before diving into the specifics of Credit Suisse X-Links Gold Shares Covered Call ETN (NASDAQ: GLDI ), let’s quickly review who this product is for and for whom it is not. I am going to quote myself from the previous article as it will sum it up quite well. Unlike in the world of stock and bond investors, the precious metals world has a wide variety of investors, ranging from individuals and institutions who just want to have precious metals exposures, to bullion purists who believe the only “real” way to invest in precious metals is to buy bullion that you hold in your hands, in your safe. This investment… is not for them. Source: SLVO: A Safer Way to Invest In Silver? GLDI is for someone who is not opposed to owning exposure to gold, either through exchange traded funds that invest in gold bullion such as the SPDR Gold Trust ETF (NYSEARCA: GLD ), the Sprott Physical Gold Trust (NYSEARCA: PHYS ) or the iShares Gold Trust ETF (NYSEARCA: IAU ), gold derivatives and indexes such as the PowerShares DB Gold ETF (NYSEARCA: DGL ), or gold mining stocks via ETFs or individual names and wants incremental income and lower volatility. What is the Credit Suisse X-Links Gold Shares Covered Call ETN ? GLDI is an exchange traded note benchmarked to the Credit Suisse NASDAQ Gold FLOWS 103 Index. The index is designed to replicate a strategy where you would write short term options against shares of GLD, the gold ETF. Specifically, Credit Suisse describes the index and strategy as follows: In a covered call (or “overwrite”) strategy, an investor holds a long position in an asset and sells call options on that same asset. Call options provide the seller with an up front premium payment, but require the seller to deliver to the buyer any upside an asset experiences beyond a set level (the “strike price”). The Gold FLOWSTM 103 Index sells approximately 3% out-of-the-money notional calls each month while maintaining a notional long position in shares. The notional net premiums received (if any) for selling the calls are paid out at the end of each monthly period. The strategy is designed to generate monthly cash flow in exchange for giving up any gains beyond the strike price. The strategy provides no protection from losses resulting from a decline in the value of the shares beyond the notional call premium. Source: Credit Suisse Below is a graphical representation of the Index Strategy: Source: Credit Suisse Performance For anyone who invested in Gold over the last 5 years, it would be tough to find a person who is happy with their investment, especially amongst those who purchased gold anywhere between $1,500 and $1,900 an ounce. With Gold currently at around $1,100 an ounce and trading within a fairly well established multi year, long term downtrend, it is not unreasonable to start thinking about what you could have done differently. While many gold bugs would justify any drop in price by diverting attention to the amount of ounces saved. Most investors though, particularly those investing in gold within their investment accounts are going to be forced to look at the value on the statement. A covered call strategy employed by this ETN would potentially lower a bit of the downside volatility and generate income by monetizing the risk you are taking for holding an inherently risky investment. Theoretically, a covered call strategy will be able to generate more income and outperform a simple buy and hold strategy in falling and flat markets. In order to generate the incremental income, you are giving up your upside over the strike price of the call options. In more volatile markets, writing call options generally makes sense as you are able to monetize the risk you are already taking by holding the underlying investment. Where you end up losing is during rising markets and your investments are called. Source: : A Safer Way to Invest In Silver? GLDI has performed exactly as expected over 1 year, 2 years, and since inception time periods. Below you can see the results of what a $10,000 investment in each of GLDI and GLD would net you. While a $10,000 investment in GLD would be worth approximately $8,504, representing a loss of nearly 15%, an investment in GLDI would be worth approximately $8,904, or a loss of approximately 11%. This hypothetical included a reinvestment of distributions. (click to enlarge) Since inception this trend stands true. A $10,000 investment from January 2013 in GLD would yield $6,518, whereas an investment in GLDI would be worth approximately $6,990. (click to enlarge) Is GLDI right for you? Perhaps. Even though GLDI has handily outperformed an outright investment in GLD, there are a number of downsides. The first risk is the strategy risk. In rising markets, writing covered calls will cap your upside on the investment. If for any reason gold spot price will rally over a sustained period of time, your upside will be limited typically to the 3% over spot price at the time the covered call was written, plus the premium received for writing the call. So for example if you purchased GLD today, for $106.26, a 3% over market price would imply $109.44, so let’s look at a $110.00 strike price, approximately 40 days out, in which case we would look at the September 18th, 2015 expiring option. The $110 strike is trading for approximately $.64, which you would receive. As we get closer to September 18th, that time premium would eradicate, and the only thing left over would be any intrinsic value. Since you are writing $110 options, and GLD is currently $106.26, there is only time value, and no intrinsic value in those options. If at expiration GLD is under $110, those options would expire worthless and you keep your $.64, in which case it is all profit. If GLD is over $110, let’s say $112, that option would be worth somewhere close to $2.00, the “intrinsic value.” At expiration, you would have the choice, either buy the option back for the $2.00, or let the shares of GLD get called away, where you would get the $110, plus the $.64 you received for writing the calls. Yes, you are making money, but you capped your upside. Because the benchmark has clear rules over what happens, the ETN index will buy back those calls approximately 5 days before expiration. The second risk here is the product structure. In this case, you must absolutely be aware that this is not an ETF, an exchange traded fund with underlying investments. This is an ETN, an exchange traded note. Unlike an ETF, ETNs are not shares of the actual underlying funds, ETNs are credit obligations, like bonds of the underlying issuer, whose value tracks a specified index. In the event of a default, owners of the ETN would be lining up for the settlement in the liquidation of the issuer. In order to invest in this ETN, you should be absolutely comfortable with Credit Suisse’s credit risk. While Credit Suisse is a seemingly sound institution, your investment in this ETN is not backed or invested in any underlying shares of gold. This is an additional risk that you should take into account. If you are not comfortable with taking on that credit risk, the alternative is to purchase your own shares of GLD and write the covered call options by yourself, to replicate this strategy. Note that you may incur additional trading fees, by both buying and selling the individual securities as well as writing and buying back any options. For smaller accounts, GLDI’s annual expense of .65% will likely be cheaper over the long term, however by owning your own shares of GLD, you will have more flexibility as to what options you will want to write. Other products that you may want to consider are the GAMCO Global Gold, Natural Resources & Income Trust (NYSEMKT: GGN ) and the BlackRock Resources & Commodities Strategy Trust (NYSE: BCX ). Both are Closed End Funds, which do carry annual fees, however there is an underlying portfolio of investments in case of liquidation. For more discussion about risk faced with ETN investing, feel free to read my previous ETN articles such as RBS ETNS: When A Good Idea Alone is Not Enough , as well as SLVO, linked above. Disclosure: I/we have no positions in any stocks mentioned, and no plans to initiate any positions within the next 72 hours. (More…) I wrote this article myself, and it expresses my own opinions. I am not receiving compensation for it (other than from Seeking Alpha). I have no business relationship with any company whose stock is mentioned in this article. Additional disclosure: None of the information discussed should be considered investment advice or a solicitation to buy or sell any securities. Please consult your investment advisor for specific recommendations.