Tag Archives: income

The Global X MSCI Colombia ETF: Rebound From 52-Week Lows
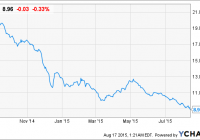
Summary Colombia is projected to have the highest Annual GDP Growth in Latin America in the next 12 months. The Global X MSCI Colombia ETF is trading below its book value and is also trading at its 52 week low. The fund has witnessed a sharp decline in its price since 2014, yet financial performance of the fund’s top 10 holdings during this year was favorable. General exposure to this ETF is a wise endeavor, while specifically investing in the banking industry may be wiser, due to its lower valuation and superior financial performance during 2014. Given the current low oil price environment, Colombia is certainly a country worth investigating for a potential rebound, as the Global X MSCI Colombia ETF (NYSEARCA: GXG ) has witnessed a sharp decline in price since September 2014; the fund reached a high of 20.78 around this time and is now trading at 8.96. Despite the risks associated with its economy being dependent on oil exports, and the fact that it has had the highest political risk among countries in Latin America, there are still ample opportunities to be found after investigating the valuation and current price of this ETF; the fund is trading below its book value and is also trading at its 52 week low. Moreover, Colombia has been among one of the fastest growing countries in Latin America, and has the highest economic growth projections for the next twelve months. GXG data by YCharts Global X MSCI Colombia ETF The fund has been consistently declining since 2014, and is extremely far from its 52 week high of 20.78. The recent decline in the price of oil has attributed to a drop in the fund’s price, and has consequently created attractive valuation : P/E ratio: 15.91 P/B ratio: 0.92 P/S ratio: 1.01 The fund’s holdings are extremely diverse, and invest into the following industries: Financial Services: 36.74% Basic Materials: 16.85% Utilities: 16.46% Industrials: 6.66% Economic Outlook Colombia has a favorable economic outlook for the next twelve months, and will lead Latin America in Annual GDP Growth. The following projections have been made for the 2nd quarter of 2016 Annual GDP Growth will increase from 2.8% to 3.2%. Inflation will remain near 4.4%. Exports will decrease by 3.1%. FDI will increase by 22.9%. Crude oil production will decrease by 0.7%. Retail sales will increase by 4.42%. Consumer spending will increase by 3.2%. Consumer credit will increase by 10.4%. Overall economic projections for the next twelve months appear to be very favorable for the country, with slight Annual GDP growth projected for the next twelve months. An increased trend of consumption and retail sales is projected for the next twelve months, which will further attribute to economic growth. Most important to note, is that the low oil price environment has not deterred FDI, as this is projected to increase by 22.9% during the next 12 months. Latin America Annual GDP Growth Comparison Recently Colombia has had the highest Annual GDP Growth, and is on track for higher economic growth during the next twelve months. While Peru and Chile have ample potential for long term recovery due to the current adverse impact of low commodity prices, a twelve month outlook provides the most favorable results for Colombia. Annual GDP Growth 2012 2013 2014 Current 2nd Quarter 2016 Projections Colombia 4 4.9 4.6 2.8 3.2 Peru 6 5.8 2.4 1.7 2.03 Argentina 0.8 2.9 0.5 1.1 0.76 Chile 5.5 4.2 1.9 2.41 2.37 Brazil 1.8 2.7 0.1 -1.6 -0.3 Source: World Bank Top 10 Holdings Overall, the financial performance of the fund’s top ten holdings has been exceptional, which makes the fund’s sharp drop in price somewhat undeserved. The fund’s holdings had a 10.6% increase in net revenue and a 10.8% increase in net income. An industry specific approach provides a mixed outlook regarding valuation and financial performance: The banking industry can be considered superior, due to its extremely attractive valuation and having exceptional growth. The utilities industry also had exceptional growth, and its valuation is relatively attractive. The consumer products industry has relatively attractive valuation, but experienced negligent growth. Increased projections for consumer spending will be a positive driver for future growth. The construction industry had substantial growth, but also has extremely high valuation. For risk seeking investors, the main holding in the oil industry has low valuation, although financial performance was not favorable in 2014. Value Based Approach Ecopetrol S.A and Bancolombia SA are two options for valued based investors to gain exposure to Colombia, as both companies have lower valuation than the ETF. Bancolombia SA’s historical P/E has been exceptionally higher in the past, with a five year P/E high of 38.61 . The banking industry holdings in the fund were among the top performing, and Bancolombia SA is a superior pick considering its net income increased by 24% while the fund’s price dropped substantially. Ecopetrol SA is a riskier pick as its net income and net revenue have been consistently declining since 2012, and sole exposure to this industry may be risky. However, valuation is the lowest of the fund’s top 10 holdings. Conclusion Now is an strategic moment for investors to gain access to Colombia’s growth, which is set to outpace other countries in Latin America during the next twelve months. The low oil price environment has created attractive valuation for the Global X MSCI Colombia ETF, which is further edified by the projected growth for Colombia. General exposure to this ETF is a wise endeavor, while specifically investing in the banking industry may be wiser, due to its lower valuation and superior financial performance during 2014. Disclosure: I/we have no positions in any stocks mentioned, and no plans to initiate any positions within the next 72 hours. (More…) I wrote this article myself, and it expresses my own opinions. I am not receiving compensation for it (other than from Seeking Alpha). I have no business relationship with any company whose stock is mentioned in this article.
Active Power: At An Inflection Point?

ACPW is a name that has long been a disappointment. But it appears that new management is showing to have an effect on shaping operations at the company – ACPW just reported its sixth quarter of greater than 1:1 book/bill. ACPW is also growing sales while managing higher gross margins – this had the effect of reducing overall cash burn, always a concern for microcaps. If ACPW can sustain its operating momentum it should scale up market cap with each quarter reported as the niche has a well-established EV/revenue multiple. Active Power (NASDAQ: ACPW ) is an interesting name that I came across recently. The company’s headquarters is coincidentally located just a few blocks away from my home. After passing by its offices time and time again, and this is a name that I’ve seen trend in the social arenas a few times over the last year, I decided to take a look into the filings. What I found looks like a company that might be at an inflection point that has long been in the making. First, ACPW is “engaged in designing, manufacturing and selling of flywheel-based uninterruptible power supply (“UPS”) products and modular infrastructure solutions (SOURCE: ACPW 10-K)”. Put simply, the company helps regulate power to facilities and entities that can ill afford to not have a steady power flow; and provides essential infrastructure to facilities and entities that want greater control over microgrids. The latter functionality taps into the burgeoning market for off-grid power production from a single or multiple sources of alternative energy production (e.g. solar power installations, wind power farms, etc.). Both UPS power regulation and microgrid applications are growing more evident value-props in 1) an increasingly stressed electrical infrastructure (international electrical infrastructures are already stressed) and 2) an infrastructure in which microgrids (read: hospitals, university campuses, massive server host facilities, etc.) are becoming more valuable. While these are long term, secular trends to be sure – there is no denying that the visibility of the necessity for equipment and services provided by ACPW is increasing. In that the value prop and visibility of value prop are set up in this instance to be longer term, I’m viewing ACPW as strictly a long-term buy and hold opportunity. Shares of ACPW likely will not trade sharply higher overnight, but I believe they will trade higher steadily over extended durations. (click to enlarge) In saying that, through 1H/15 reporting ACPW is showing to have steadily improving operations and a more consistently stable overall model. Trading at less than one times EV/revenue (TTM) and trading 30 bps below a peer group EV/revenue multiple average of 1X (consisting of Capstone Turbine (NASDAQ: CPST ), FuelCell Energy (NASDAQ: FCEL ), Maxwell Technologies (NASDAQ: MXWL ) and PowerSecure International (NYSE: POWR )), now might be a good time to consider initiating a position in ACPW. ACPW has generated ~$58 million in TTM revenues, showing a healthy revenue base for a microcap – certainly having such revenues allows the company certain flexibilities not inherent in pre/low revenue microcap models, and is on pace to achieve approximately the same figure in full year 2015 (annualizing 1H/15 performance – it should be noted that ACPW does report lumpy revenues from time to time). The company also recently posted its first quarter of positive Adjusted EBITDA in quite some time and greatly closed its long-standing net loss and negative EPS: (click to enlarge) When coupling this income statement performance with the fact that the company has ~$10.6 million in C&CE on its balance sheet, $37.4 million in assets, $19.8 million in liabilities, and $5.5 million in debt, I consider the company to not be at any near-term structural risk. ACPW’s cash, which is always important to monitor in this market cap space, should last at least the next 12 months. I anticipate the cash balance will likely last much longer, basing this assumption on ACPW’s 10-K filing and cash burn generally associated with total net loss. I could realistically see full year 2015, which through 1H/15 ACPW has shown roughly half the total cash burn as 1H/14, being the lowest cash burn print in 4 years . If ACPW can prove out 2015 to be at or near cash flow breakeven, management has not given guidance to this, this would materially move forward the bull case. Typically with microcaps, dilution and/or a reliance on debt as a result of high rates of cash burn is at or near the top of the risk list. ACPW, depending on sales ramp, might be close to negating this risk. In regards to sales at ACPW, upon reviewing the company’s 10-K filing for the year ended 12/31/14 this was a red flag to me in considering ACPW for a bullish recommendation. I noticed that the company had, as of its now 6-month-old 10-K filing, a history of falling sales on flat operating expenses – which was particularly concerning. I also knew that ACPW had changed management teams less than two years ago and the lack of progress visible on the topline was adding to my initial concerns. However, when viewing the current year’s Q1 and Q2 10-Q filings, of course, I saw the data illustrated in the image above which speaks quite to the contrary of the performance in the 10-K. ACPW appears to have turned a corner in selling as of the first two quarters of 2015. Still, even knowing this, it was encouraging to see that ACPW broke out its sales in its August Investor Deck into book to bill ratios. ACPW, as of Q2/15, reported its sixth consecutive quarter of a greater than 1.0 book to bill ratio – this has led to a much healthier trend line: (click to enlarge) Again, this increased consistency and overall scale has led to a return to positive Adjusted EBITDA for ACPW as well as increasing gross margins – another sign of increasing operating health: (click to enlarge) Finally, it should be noted that ACPW has fragmented and diversified both its geographical revenue dependence as well as its dependence on any singular revenue channel – yet more reasons to believe that the increased book to bill ratio is sustainable under the new regime: (click to enlarge) All told I believe ACPW is deserving of a hard look at this point in its development by those interested in securing an ownership in electrical grid and microgrid management. I don’t believe there is any denying that there are secular growth trends supporting both a need and desire for these types of services. ACPW, while being largely a disappointment since its IPO many years ago, appears to be changing course under new management. The story at ACPW has been slowly progressing – to management’s credit this does have quite a bit to do with the fact that ACPW is a capital equipment company – but it is now having a positive effect on the company’s health. If ACPW is at an inflection point, which I’m leaning heavily into the fact that it is, it should be able to grow its market cap. Despite improved financial performance in the first half of the year, the stock has not moved. The realization of a continuation of greater than 1:1 book to bill ratios bodes well for the company and its shares. Good luck everybody. Editor’s Note: This article covers one or more stocks trading at less than $1 per share and/or with less than a $100 million market cap. Please be aware of the risks associated with these stocks. Disclosure: I/we have no positions in any stocks mentioned, and no plans to initiate any positions within the next 72 hours. (More…) I wrote this article myself, and it expresses my own opinions. I am not receiving compensation for it (other than from Seeking Alpha). I have no business relationship with any company whose stock is mentioned in this article.

ETRACS Adds A New Leveraged MLP ETN To Its Lineup

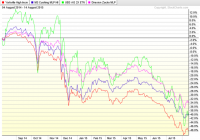
UBS ETRACS has a new leveraged ETN tracking the S&P MLP index. The ETN holds the top eight weighted MLPs from the index. This is a speculative choice for income and it will likely be very volatile. On July 14th, ETRACS newest ETN started trading on the NYSE Arca. The fund is the ETRACS 2xMonthly Leveraged S&P MLP Index ETN (NYSEARCA: MLPV ). UBS (NYSE: UBS ) has a fair selection of MLP ETNs already, and MLPV will be the ninth addition to their list in the MLP category of ETNs. This security is an unsecured debt note that tracks the S&P MLP index with 2x leverage. The S&P MLP index tracks the leading partnerships trading on the NYSE and Nasdaq, which includes both MLPs and LLCs. The index tracks 79 companies in total. The leverage in this fund is reset on a monthly basis instead of daily. Distributions are made quarterly and linked 2x to the index. Here are some features of MLPV. Market Cap-19.2 million Expense Ratio-0.95% 2x Index Yield-12.49% Maturity Date-7/14/2045 Here are the holdings of the ETN and the percentage weighted. MLPV only holds the top eight out of the 79 total constituents that the index tracks. Enterprise Products Partners LP EPD 14.78 Energy Transfer Equity LP ETE 11.25 Energy Transfer Partners LP ETP 8.08 Magellan Midstream Partners LP MMP 6.43 Plains All American Pipeline LP PAA 6.19 Williams Partners LP WPZ 4.54 Buckeye Partners LP BPL 3.61 MarkWest Energy Partners LP MWE 3.61 Here is how MLPV compares to some similar funds. Ticker Symbol Yield Expense Ratio MLPV 12.49% 0.95% ETRACS 2xMonthly Leveraged Long Alerian MLP Infrastructure Index ETN MLPL 15.02% 0.85% iPath S&P MLP ETN IMLP 5.55% 0.80% This ETN might appease people who are chasing yield at the expense of high volatility and risk. It is definitely not the kind of fund you should use if you are seeking stable and conservative income. The downturn in the oil price last year has pummeled many MLPs, including IMLP which tracks the same index as MLPV. The one year chart below shows the four highest yielding MLP ETFs. (click to enlarge) The expense ratio of .95% is much too high for my liking, but the lowest ratio for any available MLP ETF is only .45% and some even have fees as high as 5-8%, which is extremely high for any ETF. The fund that has the .45% ER is the Global X MLP & Energy Infrastructure ETF (NYSEARCA: MLPX ), but it has a drastically lower yield of 2.66% when compared to most other MLP funds. The MLP ETF I like most for finding a balance between high yield and a decent expense ratio is the Direxion Zacks MLP High Income Shares ETF ( ZMLP) which currently yields 11.33% with an net expense ratio of .65%. With that said, one should only invest in this or any MLP with the expectation of volatility. With oil prices currently depressed, this might be a relatively safer time to initiate a position in these high yielding securities. This fund is structured as an ETN rather than an ETF, and there is good reason for this. The nature of MLPs gives them the advantage of legally escaping corporate taxes, but if the partnerships are in an ETF, then the corporate tax applies to the ETF itself and thus cancels out the tax advantage of MLPs. The drawback to the ETN however, is that the distributions are considered taxable income, which is not the case when an MLP is held individually. The tax consequences of owning MLPs can be very tricky, so it is always best to consult a tax professional before investing in any MLP or MLP fund and make sure you know exactly how you will be taxed. Due to the leverage used in this ETN, I consider it speculative income and potential investors should be aware of the risks. In addition to the leverage, MLPs present volatility due to being exposed to the energy sector. In the short time that MLPV has been trading, the underlying index has seen a bit of a sell-off which resulted in a price decline in the ETN. This dip might make for a good buying opportunity, but the volatility and risk should not be underestimated. Disclosure: I/we have no positions in any stocks mentioned, and no plans to initiate any positions within the next 72 hours. (More…) I wrote this article myself, and it expresses my own opinions. I am not receiving compensation for it (other than from Seeking Alpha). I have no business relationship with any company whose stock is mentioned in this article.