Tag Archives: handle

The Refined ETF Approach To Emerging Markets Consumers

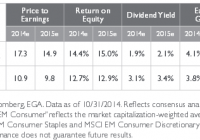
Summary More investors are diversifying with overseas exposure. Why investors should take a look at consumer sectors in emerging markets. Emerging market consumer sector ETF options. Investors have heard plenty about the rise of the emerging markets consumer in recent times, a theme easily accessed by a growing number of exchange-traded funds. Emerging markets investing, including doing so with ETFs, is changing, presenting investors with opportunities to take more tactical, thematic approaches to tap into the rise of developing world consumers. With many traditional emerging markets ETFs either too concentrated in the BRIC nations, excessively exposed to state-run enterprises or both, investors should rethink how they access emerging markets consumer trends. That includes making bets on some of the least developed developing markets. “Investors should focus on buying EM consumer companies in the least developed economies, as well as those EM companies geared towards domestic demand, rather than external demand through exports. Investors should look for stocks in the discretionary sector in countries where the consumption of staples has been satisfied, but consumption of durable goods has not,” according to Emerging Global Advisors , the company behind the EGShares family of ETFs. EGShares’ ETFs include consumer-focused offerings such as the EGShares India Consumer ETF (NYSEArca: INCO ) , the EGShares Emerging Markets Consumer ETF (NYSEArca: ECON ) and the EGShares Emerging Markets Domestic Demand ETF (NYSEArca: EMDD ). ECON, which carries a four-star rating from Morningstar, is up 15.4% over the past three years, enough to easily outpace the Vanguard FTSE Emerging Markets ETF (NYSEArca: VWO ) and the iShares MSCI Emerging Markets ETF (NYSEArca: EEM ) . The allure of ECON, one of the original dedicated emerging markets consumer ETFs, comes from its large combined weight to reform minded countries. For example, China, Mexico and India combine for over 41% of the ETF’s weight. “The new Indian government, led by Prime Minister Narendra Modi, intends to privatize state assets, increase foreign direct investment and reduce the fiscal deficit by cutting subsidies. There are also plans to deregulate the labor market and upgrade infrastructure. These improvements should unleash investment, increase efficiency, raise productivity and boost growth,” said EGShares in a whitepaper . If Modi delivers on the expected reforms, that could power INCO even higher. Often overlooked compared to other India ETFs , INCO also carries a Morningstar four-star rating. More important than that accolade is INCO’s performance. For much of the past year, India ETFs have been BRIC leaders, but INCO has shined especially bright with a gain of almost 77%. EMDD tracks the S&P Emerging Markets Domestic Demand Index, and draws from a country universe of Brazil, Chile, China, Colombia, Czech Republic, Egypt, Hungary, India, Indonesia, Malaysia, Mexico, Morocco, Peru, Philippines, Poland, Russia, South Africa, Thailand, and Turkey. Though not a pure consumer ETF, EMDD does allocate a combined 56.6% of its weight to staples and discretionary sectors. The weight to those sectors is important because consumer sectors have been key contributors to emerging markets earnings growth in recent years. “Emerging market consumer sectors have delivered higher earnings growth in four of the last seven years when compared to the broader emerging market equity index. Although earnings have disappointed over the last two years, we believe this should be a temporary relapse since consensus earnings are forecast to rebound in 2014 and 2015. Based on these estimates, EGA calculates that the EM consumer sectors would deliver earnings growth of 4.1% in 2014 and 16.2% in 2015, respectively, surpassing the rates of growth offered by the overall emerging markets index (3.8% in 2014 and 9.0% in 2015),” according to EGShares. South Africa, China and Mexico combine for over 55% of EMDD’s country weight. The ETF’s index has an impressive dividend yield of almost 3.4%. EM Consumer Fundamentals Table Courtesy: Emerging Global Advisors Tom Lydon’s clients own shares of EEM.

ETF Securities Expands Equity ETF Lineup With Two More New Funds

ETF Securities is expanding its line of factor-based equity ETFs. A closer look at the two new smart-beta, index-based ETFs. Based off ERI Scientific Beta indexing methodologies. ETF Securities, the London-based exchange-traded funds issuer known primarily for its lineup of commodities funds, is again adding to its lineup of U.S.-listed equity-based offering with the debuts of the ETFS Diversified-Factor U.S. Large Cap Index Fund (NYSEARCA: SBUS ) and the ETFS Diversified-Factor Developed Europe Index Fund (NYSEARCA: SBEU ) . ETF Securities is partnering with ERI Scientific Beta on the new ETFs. Scientific Beta is an index provider specializing in smart beta solutions and is part of the EDHEC-Risk Institute, an entity that works closely with institutions to implement academic research and improve their investment and risk management process, according to a statement . Scientific Beta’s stock selection process includes emphasizing investment factors, such as volatility, valuation, momentum and size. Factor-based funds are one of the fastest-growing segments of the ETF universe. The quality factor alone is the cornerstone of nearly 30 ETFs and issuers continue to bring an array of factor-driven ETFs to market. Since the start of 2015, JPMorgan introduced the JPMorgan Diversified Return Emerging Markets Equity ETF (NYSEARCA: JPEM ) , a multi-factor emerging markets ETF while iShares added two international ETFs to its factor-based suite. The ETFS Diversified-Factor U.S. Large Cap Index Fund tracks the Scientific Beta United States Multi-Beta Multi-Strategy Equal Weight Index, which “uses a proprietary weighting strategy to provide well diversified exposure, by combining 5 models: Maximum Deconcentration, Maximum Decorrelation, Efficient Minimum Volatility, Efficient Maximum Sharpe Ratio, and Diversified Risk Weighted,” according to ETF Securities . Financial services is the largest sector weight in SBUS at 19.2% followed by consumer cyclicals at 13.9%. No stock accounts for more than 0.72% of the new ETF’s weight. Top 10 holdings include CareFusion (NYSE: CFN ), Annaly Capital (NYSE: NLY ) and Dow component Merck (NYSE: MRK ). The ETFS Diversified-Factor Developed Europe Index Fund tracks the Scientific Beta Developed Europe Multi-Beta Multi-Strategy Equal Weight Index, which “is composed of the 700 largest and most liquid stocks listed in the following countries: Austria, Belgium, Denmark, Finland, France, Germany, Greece, Ireland, Italy, The Netherlands, Norway, Portugal, Spain, Sweden, Switzerland and the United Kingdom,” according to ETF Securities . The ETF currently holds 476 stocks, nearly a third of which are U.K. companies. France and Germany combine for over 23% of the new ETF’s weight. Top sector weights include 22.6% to financial services, 17% to industrials and 13.3% to consumer cyclicals. Both new ETFs charge 0.4% per year. SBUS and SBEU debuted on the heels of ETF Securities’ initial forays into U.S.-listed equity ETFs. Those ETFs, the ETFS Zacks Earnings Large-Cap U.S. Index Fund (NYSEARCA: ZLRG ) and the ETFS Zacks Earnings Small-Cap U.S. Index Fund (NYSEARCA: ZSML ) launched last week. ETF Trends editorial team contributed to this post.

Vanguard FTSE Pacific ETF Is Mostly Japanese Stocks, But It Looks Compelling

Summary VPL has a respectably low correlation to SPY and isn’t too volatile in its own right. The expense ratios are low and the liquidity is strong, but the ETF is currently trading at a premium to NAV. Despite the name, China is almost completely excluded while Japan and Australia dominate most of the portfolio. Investors should be seeking to improve their risk-adjusted returns. I’m a big fan of using ETFs to achieve the risk-adjusted returns relative to the portfolios that a normal investor can generate for themselves after trading costs. I’m working on building a new portfolio and I’m going to be analyzing several of the ETFs that I am considering for my personal portfolio. A substantial portion of my analysis will use modern portfolio theory, so my goal is to find ways to minimize costs while achieving diversification to reduce my risk level. In this article, I’m reviewing the Vanguard FTSE Pacific ETF (NYSEARCA: VPL ). What does VPL do? VPL attempts to track the investment results of the FTSE Developed Asia Pacific Index. The ETF falls under the category of “Diversified Pacific/Asia”. Does VPL provide diversification benefits to a portfolio? Each investor may hold a different portfolio, but I use the SPDR S&P 500 Trust ETF (NYSEARCA: SPY ) as the basis for my analysis. I believe SPY, or another large-cap U.S. fund with similar properties, represents the reasonable first step for many investors designing an ETF portfolio. Therefore, I start my diversification analysis by seeing how it works with SPY. I start with an ANOVA table: (click to enlarge) The correlation is about 77%, which is low enough that I’m expecting to see significant diversification benefits. Standard deviation of daily returns (dividend adjusted, measured since January 2012) The standard deviation isn’t too bad. For the period I’ve chosen, the standard deviation of daily returns was .889%. For SPY, it was 0.736% over the same period. While VPL is more volatile than SPY, the difference isn’t huge enough to prevent the low correlation from reducing portfolio risk if the level of exposure is right. Mixing it with SPY I also run comparison on the standard deviation of daily returns for the portfolio assuming that the portfolio is combined with the S&P 500. For research, I assume daily rebalancing because it dramatically simplifies the math. With a 50/50 weighting in a portfolio holding only SPY and VPL, the standard deviation of daily returns across the entire portfolio is 0.764%. If the position in SPY is raised to 80% while VPL is used at 20%, the standard deviation of daily returns drops down to 0.734%. This is slightly below the standard deviation of a portfolio that only holds SPY. In practice, I would want to limit a position in VPL to no more than 20% of the portfolio, but I’d prefer to use an amount that was still lower. The low correlation makes a very strong case for using VPL in a small position to enhance diversification. At 5%, the standard deviation of the portfolio would have been 0.733%. If an investor was only measuring risk based off the standard deviation of returns, it would appear that the 20% to 5% range was very reasonable. I’d lean towards being a little more conservative with the exposure. I think 10% to 5% is a fairly reasonable range. Why I use standard deviation of daily returns I don’t believe historical returns have predictive power for future returns, but I do believe historical values for standard deviations of returns relative to other ETFs have some predictive power on future risks and correlations. Yield & Taxes The distribution yield is 2.7%. It’s high enough that the portfolio could be included as part of an ETF portfolio designed for a retiring investor. If an investor wants to ensure they aren’t tempted to get into the portfolio, the strong yields are nice. Expense Ratio The ETF is posting .12% for an expense ratio, which is a very reasonable cost for the diversification. Unfortunately, most ETFs have expense ratios higher than I’d like to see. Clearly, VPL isn’t one of those ETFs. Vanguard funds usually have low expense ratios, which is one of the more appealing things about using their ETFs. Market to NAV The ETF is trading at a .22% premium to NAV currently. I think any ETF is significantly less attractive when it trades above NAV. I wouldn’t have expected such a significant premium on an ETF with over a million shares per day trading hands. I may need to dig deeper into the ETF to look for a reason for that premium and determine if it is normal for the ETF to trade at a premium. Aside from that premium, this is one of the better foreign ETFs I’ve seen. Largest Holdings The diversification within the ETF is pretty good. Despite the largest position being over 3%, the allocations drop off rapidly before we are even out of the top 10. I find that attractive because it ensures investors are getting some diversification benefits within the individual holdings as a benefit for paying the expense ratio. (click to enlarge) Investing in the ETF is largely relying on modern portfolio theory. The argument for the investment is the respectably low correlation of the portfolio to the major U.S. index funds. Making an investment requires a belief that markets are at least somewhat efficient so that the companies within the portfolio will be reasonably priced. Conclusion The ETF looks less volatile than many of the foreign ETFs I have been considering. I’m finding that to be an attractive factor even though there is significant correlation between VPL and the other international market ETFs. So far, VPL is easily one of the stronger contenders for the foreign exposure area in my IRA. The ETF simply does very well on several metrics. Toyota (NYSE: TM ) is a very solid company to have as the top holding. The most interesting thing I found while researching the ETF is that the exposure isn’t quite what I would have expected when broken down by individual countries. I figured Japan would be a significant part of the portfolio, but being over 50% of the portfolio is enough to concern me a little bit. Despite the strong focus on a single foreign country, the volatility has been much lower than competing ETFs with much broader focuses. Australia is the second largest representation at nearly 20%. That’s okay with me. BHP Billiton (NYSE: BHP ) is a quality company that I’d have no issue with having in my portfolio despite the terrible performance lately of mining stocks. Hong Kong is represented with 7% of the portfolio, but China is less than 1%. When I’m looking at something labeled “Asia Pacific”, I generally expect substantially more Chinese companies to be included. If I had commission-free trading on VPL so I could keep rebalancing the position for free, it would be a pretty much automatic pick for my foreign exposure. In that hypothetical scenario, I’d lean towards a 5% exposure. Additional disclosure: Information in this article represents the opinion of the analyst. All statements are represented as opinions, rather than facts, and should not be construed as advice to buy or sell a security. Ratings of “outperform” and “underperform” reflect the analyst’s estimation of a divergence between the market value for a security and the price that would be appropriate given the potential for risks and returns relative to other securities. The analyst does not know your particular objectives for returns or constraints upon investing. All investors are encouraged to do their own research before making any investment decision. Information is regularly obtained from Yahoo Finance, Google Finance, and SEC Database. If Yahoo, Google, or the SEC database contained faulty or old information it could be incorporated into my analysis. The analyst holds a diversified portfolio including mutual funds or index funds which may include a small long exposure to the stock.