Tag Archives: function

Consumer Discretionary ETF: XLY No. 7 Select Sector SPDR In 2014
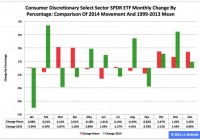
Summary The Consumer Discretionary exchange-traded fund finished seventh by return among the nine Select Sector SPDRs in 2014. The ETF was relatively weak in the first and third quarters, absolutely strong in the second and fourth quarters. Seasonality analysis of Q1 is a mixed bag, but my data interpretation points to a middle-of-the-pack performance. The Consumer Discretionary Select Sector SPDR ETF (NYSEARCA: XLY ) in 2014 ranked No. 7 by return among the Select Sector SPDRs that partition the S&P 500 into nine pieces. On an adjusted closing daily share-price basis, XLY advanced to $72.15 from $65.91, a gain of $6.24, or 9.47 percent. Thus, it behaved worse than its sibling, the Utilities Select Sector SPDR ETF (NYSEARCA: XLU ) and parent proxy, the SPDR S&P 500 Trust ETF (NYSEARCA: SPY ) by -19.27 and -4.00 percentage points, respectively. (XLY closed at $70.51 Tuesday.) XLY ranked No. 2 among the sector SPDRs in the fourth quarter, when it led SPY by 3.74 percentage points and lagged XLU by -4.54 points. And XLY ranked No. 3 among the sector SPDRs in December, when it performed better than SPY by 1.15 percentage points and worse than XLU by -2.68 points. Figure 1: XLY Monthly Change, 2014 Vs. 1999-2013 Mean (click to enlarge) Source: This J.J.’s Risky Business chart is based on analyses of adjusted closing monthly share prices at Yahoo Finance . XLY behaved about the same in 2014 as it did during its initial 15 full years of existence based on the monthly means calculated by employing data associated with that historical time frame (Figure 1). The same data set shows the average year’s weakest quarter was the third, with an absolutely large negative return, and its strongest quarter was the fourth, with an absolutely larger positive return. Generally consistent with this pattern last year, the ETF had a very small gain in Q3 and a very large gain in Q4. Figure 2: XLY Monthly Change, 2014 Versus 1999-2013 Median (click to enlarge) Source: This J.J.’s Risky Business chart is based on analyses of adjusted closing monthly share prices at Yahoo Finance. XLY performed worse in 2014 than it did during its initial 15 full years of existence based on the monthly medians calculated by using data associated with that historical time frame (Figure 2). The same data set shows the average year’s weakest quarter was the third, with a relatively large negative return, and its strongest quarter was the fourth, with an absolutely large positive return. It also shows there is no historical statistical tendency for the ETF to explode in Q1. Figure 3: XLY’s Top 10 Holdings and P/E-G Ratios, Jan. 13 (click to enlarge) Note: The XLY holding-weight-by-percentage scale is on the left (green), and the company price/earnings-to-growth ratio scale is on the right (red). Source: This J.J.’s Risky Business chart is based on data at the XLY microsite and Yahoo Finance (both current as of Jan. 13). To me, many of XLY’s component companies appear mispriced, either by a little or by a lot (Figure 3). I discussed one of them in “Amazon.com: The Most Overvalued Profitable Company In The S&P 500, Still” a while ago. Since then, Amazon (NASDAQ: AMZN ) has slipped back to unprofitability from profitability, but it remains overvalued. However, the facts on the S&P 500 consumer-discretionary sector reported by S&P Senior Index Analyst Howard Silverblatt Dec. 31 seem to be at variance with my opinions about it: He calculated its P/E-G ratio as 1.15, the lowest level of any of the index’s 10 sectors. Harrumph. The valuation issue aside, XLY’s prospects may be brighter now than they were six months ago: Among the Select Sector SPDRs, the ETF might be the biggest beneficiary of the collapse in the crude-oil commodity market, where the CME Group front-month futures price per barrel fell to $45.89 Tuesday from $107.26 June 20, a tumble of $61.37, or 57.22 percent, according to the U.S. Energy Information Administration . (The contract settled at $48.48 Wednesday, the CME Group reported.) Therefore, I would be completely unsurprised should XLY be a middle-of-the-pack performer among the sector SPDRs this quarter. Disclaimer: The opinions expressed herein by the author do not constitute an investment recommendation, and they are unsuitable for employment in the making of investment decisions. The opinions expressed herein address only certain aspects of potential investment in any securities and cannot substitute for comprehensive investment analysis. The opinions expressed herein are based on an incomplete set of information, illustrative in nature, and limited in scope. In addition, the opinions expressed herein reflect the author’s best judgment as of the date of publication, and they are subject to change without notice.
Time To Embrace Old Tech ETFs…Again

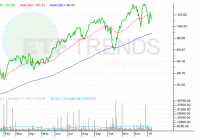
Summary Investors should look at old technology names for sturdy growth. A tech ETF with heavy weights in established, mature tech companies. Why invest in tech, particularly in the old guard. By Todd Shriber & Tom Lydon It was a prominent theme in 2014, though not one widely embraced by many exchange traded fund investors, but old school technology companies worked and did so in significant fashion. Amid various bouts of volatility and routs for Internet and social media funds, ETFs with an emphasis on the tech sector’s old guard shined bright. That includes the iShares U.S. Technology ETF (NYSEArca: IYW ) , which jumped 19.5% in 2014, topping the S&P 500 by 600 basis points in the process. Tech analysts point to sturdy tech names like Apple (NASDAQ: AAPL ) and Microsoft (NASDAQ: MSFT ), well-established companies that generated steady growth. Apple and Microsoft combine for 29.6% of IYW’s weight and the ETF’s 18.5% Apple allocation is one of the largest among ETFs that hold shares of the iPhone maker. Old tech and IYW could repeat last year’s heroics in 2015. Said BlackRock Global Investment Strategist Heidi Richardson in a recent note: I like mature technology companies-think large established brands like Intel (NASDAQ: INTC ), IBM (NYSE: IBM ) and Oracle (NYSE: ORCL ). These companies can use healthy cash balances to unlock shareholder value, are more likely to fare well if the Fed starts raising rates as expected this year and stand to benefit from continued improvement in the U.S. economy. Intel, IBM and Oracle combine for 13.7% of IYW’s weight. Tech’s durability in rising rates environments is an important consideration, particularly at this point in an aging bull market and amid expectations that the Federal Reserve will boost rates later this year. Said J.P. Morgan Asset Management in a research piece out earlier this year: Dispersion between sector valuations should continue to grow. For example, technology stocks appear attractive based on both forward and trailing P/E ratios when compared with their long-run histories. In contrast, the utilities sector, which many have used as a bond substitute, looks expensive on both measures. Tech’s increased credibility as a legitimate dividend destination also boosts the allure of ETFs like IYW. In 2014, the average dividend increase from Apple, IBM, Cisco (NASDAQ: CSCO ) and Qualcomm (NASDAQ: QCOM ) was 14%. Importantly, the tech sector has ample room for dividend growth. Adds Richardson: Some industry-leading companies have been hoarding cash. Consider that four information-age bellwethers―Apple, Microsoft, Google and Cisco―possess a combined $345 billion in cash. And the overall tech sector holds more than half of total corporate cash reserves in the U.S. With strong balance sheets, these companies are well-positioned to deliver returns through share repurchases, dividend increases and mergers and acquisitions. The $4.5 billion IYW has a trailing 12-month yield of 1.13%. iShares U.S. Technology ETF (click to enlarge) Tom Lydon’s clients own shares of Apple.

Review Of Leveraged ETFs In 2014

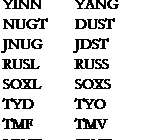
Summary There exist important reasons for ETF decay. After analysis, ETFs and particularly 3X leveraged ETFs, continued to persist in 2014. 3X leveraged ETFs are less efficient in tracking an index or basket category of securities than their un-leveraged counterparts. Introduction Across the investment and financial academic community, ETFs have been heralded as the ideal investment for passive investors. While I do not deny the numerous positive benefits of investing in an ETF over individual securities for the average retail investor, I also point out an important flaw within ETFs: ETF decay. The decay of exchange-traded funds (ETFs), and by extension, exchange-traded notes (ETNs), has been a widely known phenomenon. Some quantitative traders have attempted to profit via statistical arbitrage by buying the underlying basket securities of an ETF and short selling the ETF in order to capture the ETF decay. In this article, I analyze the decay of 3X leveraged ETFs by 25 comparing ETF pairs. (As a side note, while I reference exchange-traded products as ETFs, the same can be said for ETNs.) Important Reasons for ETF Decay The reasons for the decay of ETFs and ETNs include the following: management fees, contango & backwardation in futures based on exchange traded securities, the compounded daily effect from resetting leverage and rebalancing a portfolio to mimic an index or basket category of securities, and higher volatility contributing to higher decay. Data Here are the 25 ETF pairs used to complete the analysis of 3X leveraged ETFs for the 2014 calendar year. By definition, an ETF pair is a group of bull and bear ETFs regarding the same underlying index or other basket category. Source: Data from Yahoo Finance, Analysis in Excel (click to enlarge) Source: Data from FactSet & Yahoo Finance, Analysis in Excel Summary Results of 3X Leveraged ETF Decay To begin with, after analyzing 25 ETF pairs, 3X Bull ETFs, on average, tend to have higher volatility and kurtosis than 3X Bear ETFs. 3X Bull ETFs, on average, tend to have lower skew than 3X Bear ETFs. Second, in theory, the ideal pair of a Bull and Bear 3X ETF has a correlation coefficient of -1. Intuitively, this makes sense; for example, if an index was up +1%, then a 3X Bull ETF would be up 3% and a 3X Bear ETF would be down -3%, where the 3X ETFs would be based on the same underlying index. By definition, a correlation coefficient must be between -1 and 1. As the correlation coefficient between a pair of a Bull and Bear ETF/ETN, increases, the efficiency of this pairing decreases and the ETFs/ETNs have a higher decay. 3X leveraged ETFs were less efficient and exhibited more decay than their unleveraged counterpart ETFs. Third, in theory, ignoring commission costs and other expenses, simultaneously buying (going long on) a bear and bull ETFs on an index at the same time, cost basis, and cost value should yield a zero profit situation. In reality, a zero profit situation does not exist; in 2014, by going long on both the bull and bear ETF on the same underlying index, the median rate of return was -7.4%. When adding up the percentage performance of a bull and bear ETF on the same underlying index, the greater the summation away from 0, the greater the inefficiency and decay factor for the ETFs. Furthermore, there is a strong correlation between higher ETF/ETN volatility and higher decay. Conclusion 3X ETFs and ETNs can provide investors with an extraordinary, leveraged opportunity to capitalize on their investment ideas. Important to note, gains and losses are magnified. Some ETF pairs, such as the ProShares Ultra S&P 500 ETF ( SSO) and the ProShares Ultra 20+ Year Treasury ETF ( UBT), can be pair traded by rebalancing every month, and this strategy can help increase an investor’s rate of return. In general, 3X funds are not built to be long term positions for investors. Overall, investing in 3X ETFs and ETNs is a volatile and incredibly risky decision due to the leveraged nature of these securities. Despite the decay of leveraged ETFs, this decay has decreased from the previous year, and these ETFs seem to offer a somewhat efficient method of investors to invest by diversifying across an index or basket category in a leveraged manner.