Tag Archives: function

RWE – Recovery Postponed, Indefinitely?

RWE has warned earnings will not as expected bottom out in 2015. It will also struggle with its debt target. The announced strategic moves are not enough short term relief. Political risk is high with major pieces of legislation in a controversial debate, namely capacity markets and climate legislation. RWE is the most exposed within the peer group. As power markets in Europe get taken over by new structures, volatility and earnings risk, energy system infrastructure is a better investment proposition. RWE’s ( OTCPK:RWEOY ) earnings warning weighs stronger short term than its strategic moves. The company will continue to struggle with weak commodities and high leverage in 2015, despite the DEA sale. It may embark onto some rescuing of value through power plant sales, but it does not have the potential to deliver a similar strategic boost to E.ON. RWE is at the heat of the political storm that still has high potential to deliver more unpleasant surprises. Infrastructure and the private sector, conversely, might be beneficiaries. There are signs that private investors with longer strategic horizon are circling around distressed assets. They will gain a more important part in a decentralized energy market. Asset rotation will be a feature. My view of increasing M&A activity remains underpinned. RWE is not out of the woods yet; investors who were hoping for earnings stabilization as indicated by the company in April 2014 may be disappointed. Management has warned on earnings , saying that the earnings trough may not occur in 2015 yet. Consensus has not bottomed out for 2015 yet and it may still come down. Power prices are the unsurprising cause of the problem. Futures are pointing nowhere to a meaningful enough recovery, and the broader commodities environment is not any more supportive. RWE more than any of its peers, needs significant commodity recovery. In tandem with the above comes relentless balance sheet stress. I find little chance of material decrease of leverage. The Urenco sale will not come through short term. The CEO has further confirmed that leverage falling to 3x net debt/Ebitda by 2016 will be “extremely difficult to achieve”. I estimate just short of 4x for 2016. Attention will swiftly return to risk to the dividend. RWE may rescue some value through selling its power stations that are unprofitable abroad as announced this week. That is clearly a strategy to mitigate cash losses. It would bring minor debt reduction. Some of the company’s plant is new and competitive technology. The bulk of the RWE’s mothballing and closure programme is less than 20 years old, some plants are not even three years from commissioning. That concerns particularly gas. It is sensible that management looks to maximise value of otherwise potentially stranded assets. But, a power plant cannot be displaced and sold into another location like other capital assets. High quality and well performing equipment may still find a market value in locations with tighter reserve margins and new build demand. The CEE region comes to mind. There is also an active secondary plant market also in Asia. There will clearly be a loss of value for RWE. Investors should not hold up high hopes of significant earnings contributions from the process. Signaling power to the political powers may be stronger than actual earnings impact. Infrastructure investors have begun to look at power generation with a view of power price recovery over the long term. The prospect for capacity payments may underpin that kind of activity. Germany is uncertain on that note, but plenty of European countries putting into place capacity markets could keep M&A activity up. All of RWE’s strategic moves could in the end amount to a similar outcome to E.ON’s corporate split. The company has been vocal about reducing the share of generation to 5% of earnings. Most recently, the CFO has now said it no longer rules out a similar move even though management decided against it in 2012. RWE is in a different situation to E.ON ( OTCQX:EONGY ), in that it cannot bring as diversified a generation park into any potential new co. Merging renewables into a “genco” may remedy to a point. But in that case management would have to have a clear strategy about how it would pursue downstream brand equity and service/product packing for which renewables exposure is important. A split co will also not have the same upstream and oil and gas diversification as E.ON. That would make a genco or “upstreamco” resemble much more of a bad bank than in the case of E.ON. Importantly, it would in my view have to raise capital in order to fund the nuclear liabilities that the genco would inherit. RWE might embark onto greater strategic change beyond its already announced transformational steps. That would be a positive. But with the chances increasing that more steps are taken, so does the probability of a capital increase. I see significant potential for large parts of RWE’s business going private. Meanwhile, the debate over capacity payments rages on. The Economy Minister’s has again repeated he is opposed to capacity payments , which is out of line with market expectations. The political debate bears high potential for disappointment. My preferred exposure in all of this is infrastructure, engineering and market backbone. Editor’s Note: This article discusses one or more securities that do not trade on a major exchange. Please be aware of the risks associated with these stocks.
Palladium ETF To Enjoy Another Year Of Strong Fundamentals

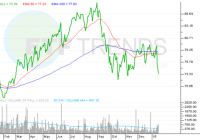
Summary Low gas prices are boosting car sales. As the car industry picks up, increased demand for catalytic converts will help boost palladium prices. Palladium’s role in the industrial space. The palladium-related exchange traded fund could shine this year as low gasoline prices and cheap bank loans help attract more new automobile buyers. The ETFS Physical Palladium Shares (NYSEArca: PALL ) has only increased 1.1% over the past year but could begin to pick up momentum in 2015. The palladium spot price is hovering around $777.3 per ounce Tuesday. Johnson Matthey Plc, a maker of catalytic converters for automobiles that uses palladium to reduce harmful emissions, projects demand for the precious metal will likely exceed supply for a fourth consecutive year in 2015, reports Laura Clarke for Bloomberg . Fueling the increased palladium demand, global car sales increased 3.4% in 2014 to a record 81.6 million vehicles. In the U.S., auto sales rose to an annualized rate of 17.2 million, the highest since November 2003. Morgan Stanley and Deutsche Bank AG both remain bullish on the palladium outlook because 70% of palladium demand comes from car-parts manufacturers. Specifically, an ounce of palladium supplies enough catalytic converters in about 10 vehicles. “Palladium is an exciting place to be because of its exposure to gasoline,” Scott Winship, a fund manager at Investec Asset Management, said in the article. “U.S. auto demand is incredibly strong and might even surpass previous peaks that we saw before the financial crisis.” Bolstering U.S. auto sales, near-zero interest rates, a stronger job market and cheap fuel costs are allowing American consumers to finally purchase some big-ticket items that they pushed off in the wake of the financial crisis. Cheaper fuel “might attract some drivers to buy a car when they otherwise wouldn’t have,” Jonathon Poskitt, the head of sales forecasting for Europe at LMC Automotive Ltd., said in the article. However, palladium investors may be wary of prices rising too quickly. When palladium jumped to a record in 2001, carmakers cut palladium demand by 40% the following year and shifted into platinum as a cheaper alternative. On the supply side, production has lagged consumption since 2012, with output declining in Russia and South Africa, the world’s top producers. Deutsche Bank calculates that the shortfall could diminish to 907,000 in ounces this year, compared to 1.2 million ounces in 2014, and the market will continue to see production deficits until at least 2020. “There’s a very bullish story there that’s going to play out in the long term,” Jeremy Baker, senior commodity strategist at Harcourt Investment Consulting AG, said in the article. “There is a good argument that palladium should outperform other precious metals.” ETFS Physical Palladium Shares (click to enlarge) Max Chen contributed to this article .

Why Indexing And ‘Smart Beta’ Are So Popular

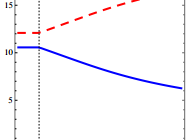
By Jack Vogel, Ph.D. Asset Manager Contracts and Equilibrium Prices Abstract: We study the joint determination of fund managers’ contracts and equilibrium asset prices. Because of agency frictions, investors make managers’ fees more sensitive to performance and benchmark performance against a market index. This makes managers unwilling to deviate from the index and exacerbates price distortions. Because trading against overvaluation exposes managers to greater risk of deviating from the index than trading against undervaluation, agency frictions bias the aggregate market upwards. They can also generate a negative relationship between risk and return because they raise the volatility of overvalued assets. Socially optimal contracts provide steeper performance incentives and cause larger pricing distortions than privately optimal contracts. Core Idea: This is a theoretical paper, so proceed with caution! However, the paper does a good job discussing the Principal/Agent Problem . Briefly stated, the “principal/agent problem” relates to how the interests of agents, who act on behalf of principals, can conflict with those of the principals. In investing, when an asset manager’s performance (or fees) is measured or benchmarked relative to an index, the potential friction (of losing fees and possibly their job) causes the manager to track closer to the index. Here is a quote from the paper: Benchmarking, however, only incentivizes the manager to take risk that correlates closely with the index, and discourages deviations from that benchmark. Thus, the manager becomes less willing to overweight assets in low demand by buy-and-hold investors, and to underweight assets in high demand. The former assets become more undervalued in equilibrium, and the latter assets become more overvalued. Within this theoretical framework, how are asset prices affected? In the graphs below, the blue solid line represents assets in large supply, and the red dashed line assets in small supply. Notice in the graph, that the more expensive asset has lower supply, while the less expensive asset has higher supply! Not surprisingly, the expected return is inverted, where the asset with less supply and is more expensive has lower expected returns, while the asset with high supply and lower price has higher expected returns. Additionally, these assets with higher (lower) supply have lower (higher) volatility. See the paper for details on why this may be so. Note, however, that if an expensive (overvalued) asset with higher volatility has a positive shock to expected cash flows, it would account for a larger portion of market movement. For this reason, managers are reluctant not to hold it, and instead will buy it, since they fear that failing to buy it may cause them to deviate from the benchmark. The main conclusion is that in this theoretical world, asset managers tend to hug the index, as their fees are tied to the index, and thus they are loath to do things that might cause them to depart from it. In the real world, this makes sense as well. Imagine the following two investment strategies that an institutional money manger must pick from: With 98% certainty, you are going to beat the index by 5% over the next 10 years. The other 2% of the time, you will lose to the index by 1%. However, you know that 3 of the years you may lose by as much as 8%! So while the long run expected returns are quite high, the return path to get there is very noisy and volatile. With 50% certainty, you are going to beat the index by 1% over the next 10 years. The other 50% of the time, you will lose to the index by 0.50%. In any given year, you will be +/- 0.25% relative to the index. Here, the long run expected returns are comparatively lower, but the return path is stable. Now, from a mathematical and economist perspective, there is an easy solution — calculate the expected value. Expected Value = beat index by (0.98%)(5%) + (2%)(-1%) = beat index by 4.88% Expected Value = beat index by (0.50%)(1%) + (50%)(-0.5%) = beat index by 0.50 % Any economist would pick option 1! It’s a slam dunk. However, the asset manager knows that picking option 1 is risky to him as an agent, as he might lose his job if the principal (owner of money) loses faith in his strategy. Ever wonder why smart beta products run rampant in the marketplace? It’s because smart beta has low tracking error versus the index. Although expected returns are modest, the manager will remain withing hailing distance of the benchmark, and a principal can’t complain too much about that, right? Unfortunately, this may not necessarily be in the principal’s best interests. Original Post