Tag Archives: function

The Liquidity Curse

Is the liquidity premium turning into a discount? Traditionally, investors have been willing to pay a premium for stock liquidity. This premium appears to be turning into a discount. Could this phenomenon last? Historically, market participants have been willing to pay a premium for liquidity. In the equity market, in the hypothetical situation of two otherwise identical stocks, the one with the better trading liquidity would be expected to command a premium over the less liquid stock. In other words, everything else being equal, a stock that is easier to trade (one with better liquidity, i. e., more trading volume) would be expected to be awarded a higher valuation multiple than the less liquid alternative. Frequent readers are well aware that I am a strong fan of Warren Buffett. He has repeatedly noted how perverse it is that investors treat stocks so differently from real estate, simply because stocks are a much more liquid investment. Paraphrasing Mr. Buffett, he recently remarked how absurd it would be if a homeowner liquidated his or her home just because a neighboring home was sold at a discount versus its fair value. Homeowners do not track the theoretical value of their homes on a daily basis, and their investment psychology is not affected by the price fluctuations in their homes anywhere near to the extent that they are when they see the price swings in their stock holdings. Thus, Mr. Buffett often reminds us that, in the short term, the equity market functions as a voting machine, whereas in the long run, it is more like a weighing machine. That is one of the key reasons behind the success of long-term equity investing. In the long run, the stock market weighs the cash flow generating ability of the underlying equities, whereas in the short term, fads and popularity tend to determine the price at which a particular stock trades at specific point in time. The implied discrepancy is what often creates wonderful buying opportunities in very desirable equities for the long term. How could trading liquidity ever be a bad thing? In the short run , better stock liquidity can certainly work against a stock price. Particularly in severe market-wide corrections (or if a specific stock is heavily owned by leveraged traders), a liquid stock may suffer disproportionately in the short term as traders take advantage of the relatively high liquidity to raise cash. This is when particularly attractive entry points are often created for long-term investors, but also why I advocate that such investors never use margin debt to increase their exposure to stocks. Owning stocks on a leveraged basis does potentially expose market participants to a sort of ‘liquidity curse’. One may receive a margin call and be forced to liquidate a particular stock in a sudden market correction. But other than that, trading liquidity should always be considered a positive characteristic in a stock, in my view. Still, and perhaps because investors seem to be increasingly shunning volatility, it appears almost as if the historical liquidity premium may be turning into a discount, and that the liquidity curse may be becoming more widespread and more of a permanent feature across equities! Much has been written lately about the millennials. The so-called millennial generation does seem generally less open to equity investing than previous generations were at the time they were in the age range of millennials today. Having seen their parents go through the burst of the TMT bubble and the global financial crisis may have traumatized millennials enough to generally shun investing in publicly traded equities, at least for the time being. That said, investing in private equity seems much more currently popular. This is reflected both in the staggering valuations now prevalent in a number of late-stage venture investments, as well as in the growing popularity of ‘crowdfunding’. More investors than in the past, perhaps bolstered by young people including millennials, seem to be increasingly comfortable tying up their funds in illiquid investments. Equity is equity, and that which is not traded in the public markets is almost by definition riskier than publicly traded stocks, even everything else being equal. Thus, it would seem as if more people are choosing venture capital and private equity at the expense of the public markets, at least implicitly preferring trading illiquidity. One hypothesis I have for this phenomenon is that it is less traumatic for those investors not to know exactly how much a particular equity investment they own is worth at a particular point in time, just as is the case in real estate.
Are Rate-Sensitive ETFs Suggesting Economic Weakness Ahead?

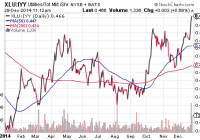
I am baffled by the economic acceleration certainty that nearly every respected voice has endorsed. In spite of the rosiest government data on jobs and GDP, which ETF asset classes proved most resilient in a month of volatile price movement? Utilities and REITs. The more the public is being told about the inevitability of rate increases, the greater the momentum for proxies like XLU and VNQ. Lost in the bull market euphoria is the reality that economists have been dead wrong about the direction of asset prices, particularly bond prices. Last December, when 55 of the most prestigious economists across a wide range of institutions had been polled by Bloomberg about where the 10-year yield (3.0%) would end the year, each of the 55 professionals anticipated higher rates. The average of those estimates? 3.41%. And yet, the 10-year will finish the year closer to 2.25%. That is one heck of an astonishing miss for the entire professional community. This December, polling of economists has produced an average forecast for the 10-year yield at 3.0% by the close of 2015. In other words, they expect intermediate term rates will climb in 2015, and yet, the projections merely approximate where 2013 ended. Even if the recent crop of poll respondents are correct this time around, what does this “non-normalization” of rates tell us about the highly touted strength of the U.S. economy? For all the hoopla, I am baffled by the economic acceleration certainty that nearly every respected voice has endorsed. Will Q4 gross domestic product (GDP) be as robust as the 5% in Q3? Not likely. Will Q1 2015 be better than the average of 2.1% sub-par growth that has existed each year since the Great Recession ended? Probably not. For one thing, lower bond yields have been warning U.S. investors that the world’s stagnation alongside regional recessions will eventually weigh down the U.S. It is one thing to pretend that the U.S. is a self-contained economic island, yet quite another thing to ignore the reality that close to 50% of corporate profits come from overseas. Moreover, there are a variety of potential crises that could sap the world (and yes, the U.S.) of economic demand, from a disorderly slowdown in China to an emerging market credit collapse to a second iteration of a euro-zone break-up scare. Need proof that scores of investors remain unconvinced by the notion that all is perfect in stock-land? In spite of the rosiest government data on jobs and GDP – in spite of strong retail sales as well as consumer confidence readings – which ETF asset classes proved most resilient in a month of volatile price movement? Utilities and REITs. Are The Bets On Lower Rates Still Continuing? MOM% SPDR Select Sector Utilities (NYSEARCA: XLU ) 9.0% iShares DJ Utilities (NYSEARCA: IDU ) 8.7% Vanguard Utilities (NYSEARCA: VPU ) 8.6% iShares Cohen Steers Realty Majors (NYSEARCA: ICF ) 4.2% Vanguard REIT (NYSEARCA: VNQ ) 4.2% SPDR DJ REIT (NYSEARCA: RWR ) 4.1% iShares DJ Total Market (NYSEARCA: IYY ) 1.0% If an investor is looking for modest growth in an area less tied to the economy, he/she may journey to the consumer staples segment or the health care sector. They are frequently identified as “non-cyclicals” since they represent things we need in good times and bad. And if an investor is looking for more total return in areas less tethered to economic well-being, he/she often travels to utilities and REITs. The exception to that rule? If rates are expected to rapidly rise across the yield curve, an investor would tend to shy away from the rate sensitivity associated with utilities and REITs. That’s not happening. In fact, the more the public is being told about the inevitability of rate increases, the greater the momentum for proxies like XLU and VNQ. The price-ratios for XLU:IYY as well as VNQ:IYY are at or near their highest points of 2014. I am not advocating that investors abandon economically sensitive stock assets let alone chase yield-sensitive stock segments. On the other hand, just as I recommended throughout 2014, I believe it makes sense to remain committed to longer-term bonds in funds like iShares 10-20 Year Treasury (NYSEARCA: TLH ) as well as lower volatility stocks across the sector spectrum. One of my largest client holdings, iShares USA Minimum Volatility (NYSEARCA: USMV ), is diversified across all of the economic sectors; the top 3 segments are health care, financials and information technology. What makes USMV particularly attractive in the current environment? The equities have lower volatility properties relative to the U.S. market at large, offering the possibility that losses during declining markets will be less dramatic. Similarly, gains in rising markets will emanate from exposure to strong economy stock sectors as well as weaker economy stock sectors. Click here for Gary’s latest podcast. Disclosure: Gary Gordon, MS, CFP is the president of Pacific Park Financial, Inc., a Registered Investment Adviser with the SEC. Gary Gordon, Pacific Park Financial, Inc, and/or its clients may hold positions in the ETFs, mutual funds, and/or any investment asset mentioned above. The commentary does not constitute individualized investment advice. The opinions offered herein are not personalized recommendations to buy, sell or hold securities. At times, issuers of exchange-traded products compensate Pacific Park Financial, Inc. or its subsidiaries for advertising at the ETF Expert web site. ETF Expert content is created independently of any advertising relationships.

How Would A Portfolio Based On The Most Followed SA Stocks Have Performed In 2014?

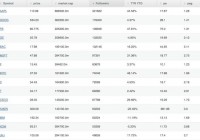
Summary In this article we examine how a portfolio created from the most followed stocks on Seeking Alpha would have performed in 2014. We create three portfolios: equal weighted, weighted based on the number of followers and weighted based on market cap. How did the portfolios do? Read on to see the results. The Most Followed Stocks The SA 30 in order of popularity: (click to enlarge) (click to enlarge) Total_Return data is from Morningstar (1/1/2014 – 12/26/2014), except for GOOG, which is from Y-CHARTS. Sixteen Dow components make the list: T, CAT, CVX, CSCO, KO, XOM, GE, IBM, INTC, JNJ, JPM, MCD, MSFT, PFE, PG and VZ. By Sector the Portfolio breaks down as follows: Basic Materials: COP, CVX and XOM Consumer Goods: PG, F, AAPL and KO Financial: BAC, C, JPM, NLY and WFC Healthcare: PFE, JNJ and GILD Industrial Goods: GE and CAT Services: MCD, NFLX and SBUX Technology: T, VZ, YHOO, MSFT, GOOG, IBM, INTC, FB, and CSCO Performance (click to enlarge) (click to enlarge) Thirteen of the 30 stocks outperformed SPDR S&P 500 Trust ETF (NYSEARCA: SPY ) Year to Date. The equally weighted portfolio has a Total Return YTD of: 11.67% The equally weighted portfolio current yield is: 2.56% Technology companies lead the best performers with INTC, FB, AAPL, MSFT, CSCO and YHOO leading the pack. Five companies have negative Total Return YTD: GE, XOM, CVX, NFLX, IBM and AMZN. The equal weighted portfolio under performs SPY by a significant margin, returning 11.67% compared to 15.06%. It does have a respectable yield of 2.56%. A portfolio weighted by number of followers: Stock Percentage of Portfolio Apple (OTC: AAPL ) 15.62% Google (NASDAQ: GOOG ) 8.56% Facebook (NASDAQ: FB ) 5.34% General Electric (NYSE: GE ) 5.02% Bank of America (NYSE: BAC ) 4.96% Microsoft (NASDAQ: MSFT ) 4.73% Ford (NYSE: F ) 3.93% Intel (NASDAQ: INTC ) 3.59% Citigroup (NYSE: C ) 3.50% AT&T (NYSE: T ) 3.36% Cisco (NASDAQ: CSCO ) 3.29% Amazon (NASDAQ: AMZN ) 3.07% International Business Machine (NYSE: IBM ) 3.02% Exxon Mobil (NYSE: XOM ) 2.44% Johnson & Johnson (NYSE: JNJ ) 2.36% Verizon (NYSE: VZ ) 2.28% Pfizer (NYSE: PFE ) 2.09% Coca-Cola (NYSE: KO ) 1.92% JPMorgan Chase (NYSE: JPM ) 1.88% Yahoo! (NASDAQ: YHOO ) 1.84% Starbucks (NASDAQ: SBUX ) 1.83% Procter & Gamble (NYSE: PG ) 1.82% Annaly Capital Management (NYSE: NLY ) 1.80% Gilead Sciences (NASDAQ: GILD ) 1.78% Wells Fargo (NYSE: WFC ) 1.76% Caterpillar (NYSE: CAT ) 1.66% Chevron (NYSE: CVX ) 1.66% McDonald’s (NYSE: MCD ) 1.64% ConocoPhillips (NYSE: COP ) 1.63% Netflix (NASDAQ: NFLX ) 1.61% The Total Return YTD of the SA 30 weighted by followers: 16.9% SA 30 weighted by followers yield: 2.15% Weighting by number of followers provides better returns and beats SPY with returns of 16.9% compared to 15.06%. This portfolio is not very diverse with AAPL making up 15.62% (no wonder there are so many articles about AAPL) and the top four holdings make up over a third of the portfolio. Portfolio Weighted by Market Cap: Stock Percentage of Portfolio Apple 11.31% Exxon Mobil 6.68% Microsoft 6.68% Google 6.13% Johnson & Johnson 4.98% Wells Fargo 4.85% General Electric 4.38% Procter & Gamble 4.27% JPMorgan Chase 3.96% Facebook 3.81% Chevron 3.62% Pfizer 3.37% Verizon 3.36% Bank Of America 3.32% Coca Cola 3.18% Intel 3.07% AT&T 3.00% Citicorp ( C ) 2.79% International Business Machine 2.72% Cisco 2.45% Amazon 2.42% Gilead Sciences 2.39% McDonald’s 1.56% ConocoPhillips 1.46% Starbucks 1.05% Ford 1.01% Caterpillar 0.97% Yahoo! 0.82% Netflix 0.35% Annaly Capital Management 0.18% The Total Return YTD of a portfolio weighted by Market Cap: 15.27 Market weighted Portfolio Current Yield: 2.32% The portfolio weighed based on Market Cap narrowly beats SPY: 15.27% to 15.06%. This portfolio is also lacking in diversity with the top four holdings making up over 30% of the portfolio. Dividend Data (click to enlarge) All dividend data is from Seeking Alpha The list contains seven dividend aristocrats: T, CVX, KO, XOM, JNJ, MCD and PG. The same seven stocks are also dividend champions. Dividend Contenders or Challengers: COP, VZ, IBM and SBUX Of these eleven stocks that made at least one of the above lists only two outperformed the SPY for total return YTD: PG and JNJ. A fluke or were these best of breed DGI stocks overbought coming into 2014? Eleven of the stocks have yields of 3% or greater: NLY, T, VZ, COP, CVX, GE, MCD, PFE, F, XOM and CAT. Conclusions Overall the most followed stocks on SA had uninspiring performance. With equal weighting the top 30 underperformed the SPY. Weighted by number of followers they did better – but not significantly. From my perspective, this is not that surprising; although I believe the SA crowd as a whole is an intelligent investment community, it’s hard to outperform when selecting stocks that are so closely followed. Others may come to different conclusions – please comment I’d like to know what you think. Ideally I would have liked to do this based on the most followed stocks as of January first of 2014, I unfortunately did not have that data. My plan is to periodically report on this portfolio in 2015 so we can get a better calibration of how the most followed stocks at the beginning of the year perform going forward. I did not check the number of followers for every ticker in the SA stock universe. I checked the entire S&P 500 and a few hundred others. If anyone believes that I have missed a stock that should be in the Top 30, please let me know. I selected 30 stocks to match the number of stocks in the DJI. I can be convinced to add more if readers feel it would be useful. Obviously there is more data and inferences that can be made about these stocks – if you have any particular requests let me know. I am not a professional advisor or researcher. I am an individual investor who studies investing and shares my thoughts. I encourage all investors do their own due diligence and please share your findings. I strongly feel the best thing about Seeking Alpha is the sharing of ideas. Please comment; I value your input. Divergent opinions are welcome. Editor’s Note: This article discusses one or more securities that do not trade on a major exchange. Please be aware of the risks associated with these stocks.