Tag Archives: function

PBS Is Just What I’m Not Looking For In An ETF
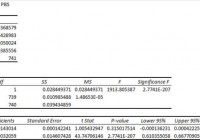
Summary I’m taking a look at PBS as a candidate for inclusion in my ETF portfolio. A limited underlying index, high standard deviations, moderate correlation, weak yields and high expense ratios make this a poor fit for my tastes. The best things going for the portfolio is decent (but not great) liquidity. I’m not assessing any tax impacts. Investors should check their own situation for tax exposure. Investors should be seeking to improve their risk-adjusted returns. I’m a big fan of using ETFs to achieve the risk-adjusted returns relative to the portfolios that a normal investor can generate for themselves after trading costs. I’m working on building a new portfolio and I’m going to be analyzing several of the ETFs that I am considering for my personal portfolio. One of the funds that I’m considering is the PowerShares Dynamic Media Portfolio (NYSEARCA: PBS ). I’ll be performing a substantial portion of my analysis along the lines of modern portfolio theory, so my goal is to find ways to minimize costs while achieving diversification to reduce my risk level. What does PBS do? PBS attempts to track the total return (before fees and expenses) of the Dynamic Media IntellidexSM Index. At least 90% of the assets are invested in funds included in this index. The index only includes the common stock of 30 companies, all of which are considered U.S. Media companies. PBS falls under the category of “Communications.” Does PBS provide diversification benefits to a portfolio? Each investor may hold a different portfolio, but I use (NYSEARCA: SPY ) as the basis for my analysis. I believe SPY, or another large cap U.S. fund with similar properties, represents the reasonable first step for many investors designing an ETF portfolio. Therefore, I start my diversification analysis by seeing how it works with SPY. I start with an ANOVA table: (click to enlarge) The correlation is mediocre at 85%. I want to see low correlations on my investments. Extremely low levels of correlation are wonderful for establishing a more stable portfolio. I consider anything under 50% to be extremely low. However, for equity securities an extremely low correlation is frequently only found when there are substantial issues with trading volumes that may distort the statistics. Standard deviation of daily returns (dividend adjusted, measured since January 2012) The standard deviation is great. For PBS it is .9703%. For SPY, it is 0.7300% for the same period. SPY usually beats other ETFs in this regard, but this combination of standard deviation and correlation isn’t going to do much good under modern portfolio theory. Liquidity looks acceptable Average trading volume isn’t very high, a bit over 40,000, but that also isn’t low enough to be a major concern for me. Mixing it with SPY I also run comparisons on the standard deviation of daily returns for the portfolio assuming that the portfolio is combined with the S&P 500. For research, I assume daily rebalancing because it dramatically simplifies the math. With a 50/50 weighting in a portfolio holding only SPY and PBS, the standard deviation of daily returns across the entire portfolio is 0.8182%. With 80% in SPY and 20% in PBS, the standard deviation of the portfolio would have been .7558%. If an investor wanted to use PBS as a supplement to their portfolio, the standard deviation across the portfolio with 95% in SPY and 5% in PBS would have been .7352%. Why I use standard deviation of daily returns I don’t believe historical returns have predictive power for future returns, but I do believe historical values for standard deviations of returns relative to other ETFs have some predictive power on future risks and correlations. Yield & Taxes The distribution yield is .50%. I simply don’t see this as a useful holding for retiring investors. The combination of mediocre correlation and high standard deviation results in an ETF that is unlikely to lower the total risk profile of the portfolio unless it was used in phenomenally small amounts. The distribution yield is weak, which means retiring investors may have a stronger temptation to sell shares if their income is too low. The point of building the portfolio with ETFs is to avoid active management outside of rebalancing. I can deal with a weak yield because I’m far from retirement, but it is starting to feel like the ETF is looking for a fairly small niche to fill. I’m not a CPA or CFP, so I’m not assessing any tax impacts. Expense Ratio The ETF is posting .62% for a gross expense ratio, and .62% for a net expense ratio. I want diversification, I want stability, and I don’t want to pay for them. For an ETF that already left me wanting more in most categories, being hit with a big expense ratio isn’t the way to draw me back in. Market to NAV The ETF is at a .04% premium to NAV currently. Premiums or discounts to NAV can change very quickly so investors should check prior to putting in an order. The ETF is large enough and liquid enough that I would expect the ETF to stay fairly close to NAV. Generally, I don’t trust deviations from NAV and I will have a strong resistance to paying a premium to NAV to enter into a position. Largest Holdings The diversification can’t be very good when there are only 30 companies in the underlying index. The chart below supports that assessment. The top seven companies are each more than 5% of the total holdings. (click to enlarge) Conclusion I’m currently screening a large volume of ETFs for my own portfolio. The portfolio I’m building is through Schwab, so I’m able to trade PBS with no commissions. I have a strong preference for researching ETFs that are free to trade in my account, so most of my research will be on ETFs that fall under the “ETF OneSource” program. PBS won’t make the next round of comparison. It feels like the ETF would be most useful for making short-term bets on the sector. Some sector ETFs can provide additional value to a portfolio by improving the balance of different exposures, but I don’t see that benefit here.
Positioning For An Oil ETF Rebound? Watch For Contango

Some may consider an Oil ETF to play a rebound in prices. Investors should consider the effects of the underlying market on a futures-based ETF. Potential alternatives to play a recovery in the oil market. As crude oil prices dip to fresh lows, contrarian traders are becoming increasingly antsy for a rebound. Traders may try to tap into an oil-related exchange traded fund to capitalize on a potential recovery, but one should first look under the hood and understand how the futures market can affect an ETF. For instance, many would likely turn to the United States Oil ETF (NYSEArca: USO ) , which tracks West Texas Intermediate crude oil futures, to play a potential turn in the energy market. USO is the largest and most popular oil-related ETF option on the market, with $1.2 billion in assets and $387 million changing hands daily, according to Attain Capital . However, oil traders should be aware that USO tracks front-month WTI future contracts and the underlying oil market is currently in a state of contango. Consequently, USO could experience a negative roll yield when rolling a maturing futures contract. Contango occurs when the price on a futures contract is higher than the expected future spot price, which creates the upward sloping curve on future commodity prices over time. Essentially, the phenomenon reflects a current spot price that is lower than the futures price. For instance, WTI futures were trading around $48.2 per barrel Tuesday for the February 2015 delivery, but contracts with a later delivery are trading higher, with contracts for December 2015 delivery at $55.1 per barrel. Commodity prices are typically higher in the future because people would rather pay a premium to have the commodity on a later date instead of paying the costs for storage and the carry costs for buying the commodity right now. While this phenomena is a normal occurrence in the futures market, contango can have a negative effect on ETFs. Specifically, ETFs that hold futures contracts sell the contracts before they mature and purchase a later-dated contract. In a contangoed market, the ETF loses money each time it rolls contracts to a costlier later-dated contract – the fund would technically sell low and buy high. Consequently, long-term investors may notice underperformance to the oil market since the ETF holds front-month contracts and would see a slight cost when rolling each front-month contract . According to Attain Capital: This is why USO has drastically underperformed the “spot price” of Oil over the past five years, with USO having lost -39% while the spot price of Oil went UP 48%. It is like an option or insurance premium – a declining asset with all else held equal. Alternatively, the PowerShares DB Oil ETF (NYSEArca: DBO ) and the United States 12 Month Oil ETF (NYSEArca: USL ) provide exposure to WTI oil, but include a different weighting methodology to limit the negative effects of contango. DBO can include contracts as far out as 13 months and dump contracts at any point. USL, on the other hand, ladders 12 months of contracts to diminish the effects of backwardation and contango. Additionally, Attain Capital suggests buying the energy industry ETF , such as the Energy Select Sector SPDR ETF (NYSEArca: XLE ) to capitalize on a potential rebound since companies have other factors that don’t relate to oil prices. More aggressive traders can fuel bets with leveraged energy funds, like the Direxion Daily Energy Bull 3X Shares ETF (NYSEArca: ERX ) , which takes the 300% performance of energy stocks on a daily basis. Investors can also look at the hammered alternative energy stocks, like Tesla (NASDAQ: TSLA ), which has been out of favor since lower oil prices make green energy plays seem less viable. The Market Vectors Global Alternative Energy ETF (NYSEArca: GEX ) and the First Trust NASDAQ Clean Edge Green Energy Index ETF (NasdaqGS: QCLN ) both include heavy tilts toward TSLA and other clean energy picks. Max Chen contributed to this article .

Any Hope For A Gold And Oil ETF Rebound In 2015?

Gold and oil were the two most-talked-about commodities last year thanks to their awful performances. These two widely-followed commodities witnessed dire trading in 2014 with the latter being thrashed heavily by the strength of the greenback, demand-supply imbalances, and cooling geo-political tension in the second half of the year. While muted global inflation, reduced demand from key consuming nations like China and India restricted the yellow metal’s northward ride, the return of worries in the Euro zone, and poor data points from Japan and China have made oil more diluted. As a result, oil prices plummeted more than 50% in 2014 and gold registered the first consecutive annual decline last year since 2000 . Some are also worried that the slump could continue as the Fed is now on its way to hike the key rate this year. The Fed’s step strengthened the dollar and in turn marred commodity investing. Great Start to New Year for Gold Having lost more than 8% in the last six months, SPDR Gold Trust ETF (NYSEARCA: GLD ) bounced back to start the New Year gaining about 2% in the last two trading sessions as of (January 5, 2014). So, did the biggest gold mining fund, Market Vectors Gold Miners ETF (NYSEARCA: GDX ) , which has added about 5.8% during the same phase. Gold miners – which often trade as leveraged plays on gold – delivered two successive years of negative performances losing about 50% in 2013 and 16% in 2014. A sagging stock market and worries over Greece political crisis indicating the nation’s likely way out of the Euro area bolstered the safe-haven appeal of gold to start this year. As a result, gold bullion crossed the $1,200/ounce mark after a few months. In such a situation, investors might want to know the upcoming course of gold related ETFs. We do not expect the latest uptrend to last long. Most of the macroeconomic indicators that went against gold prices last year like the Fed policy, strong U.S. dollar and deflationary spell, will nothing but intensify this year. GLD is trading a little below its 200-day simple moving average but higher than 50 and 9-day simple moving averages which signify long-term bearishness for the ETF. The biggest fund in the space, GLD, is yet to enter the oversold territory as depicted from the above chart. The ETF is trading at a Relative Strength Index (RSI) value of 53.48 indicating there is room for further erosion in the price once the risk-off sentiments drop out of sight. The trend was similar for GDX too with current price trading below long-term averages and above the short-and-medium term averages. Its RSI value stands at 56.54. In a nutshell, miners will likely follow the underlying metal’s direction, obviously with higher magnitude, this year. Overall, the gold mining space will likely see a mixed 2015 and will be busy paring down losses incurred last year. Investors interested to bet on gold should follow the space closely as it is expected to be on a roller coaster ride this year. No New Year Party for Oil Unlike gold, there was no celebration for oil this New Year. WTI crude prices are now below $50, marking a massive slide from their level a year ago. Needless to say, this was a new multi-year low. Persistent supply glut, no production cut by OPEC as well as the U.S. will keep the space under pressure. United States Oil Fund ( USO ) is trading a little below long, medium and short-term moving averages which signifies utter bearishness for the product. In fact, it seems as though oil does not have any driver which can revive it in the near term. However, the product is presently trading at a RSI value of 22.53 indicating that it slipped into oversold territory and might change its course soon after hitting a bottom. Per barrons.com , Citigroup’s commodity group cautioned about a frustrating 2015 for oil and slashed its oil-price forecast for this year and the next to even lower than its most bearish prior estimates. Citi cuts price expectation for WTI crude from $72/barrel to $55 in 2015 while Brent oil price expectation has been reduced to $63 a barrel from $80 a barrel. Bottom Line In short, 2015 should not be great for both commodities and the related ETFs barring some occasional spikes which can be defined as a correction. Investors dying to look for a sustained trend reversal in these commodities, should wait for a big Chinese and Euro zone stimulus, which may bolster the regions’ waning manufacturing industry spurring the usage of oil and goading investors to buy more gold (notably, China is the world’s largest consumer of the yellow metal). Investors should also look out for a pull back in oil production and the return of geo-political tensions. As far as the Fed rate hike is concerned, we believe that the most of it has been priced in at the current level, suggesting that either way, it will be another interesting year for oil and gold.