Tag Archives: etf-hub

Building The Core With Vanguard: Foreign Stocks

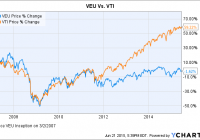
Summary Every ETF investor needs to consider what holdings will form the very core of their portfolio. For the portion relating to foreign stocks, the Vanguard FTSE All-World ex-US ETF is a compelling choice. Also discussed are reasons every investor should consider holding foreign stocks in their portfolio, along with links to additional background reading for those who desire such. For my first articles for Seeking Alpha, I decided to start simple: tackling the question of building a solid core portfolio using ETFs offered by Vanguard Funds. I started with domestic stocks featuring the Vanguard Total Stock Market ETF (NYSEARCA: VTI ), followed by domestic bonds featuring the Vanguard Total Bond Market ETF (NYSEARCA: BND ). As can quickly be discerned, however, both of the above options relate to U.S.-centric investments. For their portfolio to be complete, investors should also seriously consider going beyond the borders of the U.S. and into the world of foreign equities. For your first venture into this brave world, the Vanguard FTSE All-World ex-US ETF (NYSEARCA: VEU ) makes an excellent choice. Why Foreign? Why Now? For an overview of the risks and benefits of investing in foreign stocks, I offer this article from my personal blog. It offers a relatively brief, yet comprehensive overview, supported by links to further reading if desired. Essentially, what you will read there is that foreign stocks offer two potential benefits, growth and diversification . Hopefully, this material will answer that first question, Why Foreign? But what about that second question, Why Now? I hope to write about the concept of rebalancing one’s portfolio in a future article. But for now, let me just say that a key to good portfolio management is to “sell high and buy low;” in other words, to take a certain portion of your investments out of asset classes that have outperformed and put them to work in asset classes that have underperformed. With that in mind, have a look at the graph below. It compares Vanguard’s VTI (Domestic Stocks) with the ETF featured in this article, VEU, since VEU’s inception on March 2, 2007: VEU data by YCharts Do you notice anything interesting about that chart? I thought you might. After a period of relatively similar performance between roughly 2007 and 2012, U.S. stocks have outperformed their foreign brethren by a fairly significant margin. Further, foreign stocks have been roughly flat over the roughly 8-year span covered by the chart, while U.S. stocks have risen almost 60%. Let me be clear, there have doubtless been good reasons for this. While the U.S. economy has struggled, in particular since 2008, other countries have done even worse. Further, I am in no way predicting that foreign stocks will outperform their U.S. brethren moving forward. I don’t have a crystal ball. However, based on an analysis similar to this that I performed approximately two months ago, I decided to lower my personal weighting in U.S. stocks by 2.5% and shift those funds to foreign stocks. Certainly, this is no dramatic move. I simply decided that I wished to take a little from the asset class that had experienced significant gains and move it to the class that had been flat. With that big picture background, let’s now turn to the composition of VEU, as well as the expense ratio. Composition VEU is named well (Vanguard FTSE All-World ex-US ) because, as it happens, that is the name of the index it tracks. As such, VEU offers incredibly broad and diversified foreign exposure. As of the latest factsheet , we find that VEU actually contains a slightly greater number of securities than the index, 2,492 vs. 2,377. Let’s look a little closer. First, here is the fund’s geographic allocation: As you can see, the fund leans heavily toward developed markets such as Europe and the Pacific (Asia). At the same time, it offers reasonable exposure to emerging markets; those whose economies are not as fully developed and therefore offer greater potential for growth, albeit with a greater level of risk. If you back out the 18.8% in emerging markets, you quickly realize that 81.2% of the fund is invested in what are generally considered developed markets. Diving in a little more specifically, here are the Top 10 countries represented in the fund. If you add up the numbers, you will see that these countries comprise 73.4% of the total. Of these, China is the only country included in the Vanguard FTSE Emerging Markets ETF (NYSEARCA: VWO ). Let’s now take a look at one last perspective, the Top 10 holdings: To give you some small sense of the sorts of companies that constitute the largest portions of the fund, here are extremely brief synopses of the Top two; Nestle SA ( OTCPK:NSRGY ) and Novartis AG (NYSE: NVS ): Nestle SA – Nestle is the largest food company in the world , measured by revenues. Encompassing baby food, bottled water, coffee & tea, dairy products, frozen food, pet food, snacks and more. The list of brands is made up of legendary names that you will instantly recognize, and Wikipedia states that 29 of these brands each have annual sales of over $1 billion. The company operates in 197 countries, with factories in 86 countries. Novartis AG – Novartis is the largest pharmaceutical company in the world , measured by revenues. According to its latest annual report , Novartis’ products are available in more than 180 countries worldwide. Its pharmaceuticals arm has 135 projects in development, its subsidiary Alcon is the #1 eye care company worldwide, and its subsidiary Sandoz is the #2 global provider of generic medicines. Looked at from any of these vantage points, I submit that VEU is a wonderful core holding for the foreign, or international, component of your portfolio. Costs and Expenses At 0.14%, VEU’s expense ratio is somewhat higher than that of either VTI or BND, the other two ETFs I have featured. And yet, it too is one of the lowest in the industry. Bear in mind, this is an ETF that is dealing with assets all over the world, across different stock exchanges and the like. To that, of course, you have to add your trading commissions. Vanguard offers its own ETFs commission-free, and TD Ameritrade offers a decent selection of commission-free Vanguard ETFs. Suitability As a core holding, VEU is suitable for all portfolios. While I do believe that all investors should hold at least some portion of their portfolio in foreign stocks, I understand that you must do so at a level at which you are comfortable. Alternatives Another ETF worth considering, particularly if your brokerage offers it commission-free, is the iShares Core MCSI Total International Stock ETF (NYSEARCA: IXUS ). It too sports a very competitive 0.14% expense ratio, and covers basically the same range of countries, including emerging markets, as does VEU. The ETF’s size, as well as its average trading volume, is substantially smaller than VEU, but I do not believe this should be any impediment. As a Fidelity client, I use VEU for my core position and IXUS, which I can trade commission-free, for small incremental investments and/or to adjust portfolio weightings. Editor’s Note: This article discusses one or more securities that do not trade on a major U.S. exchange. Please be aware of the risks associated with these stocks. Disclosure: I am/we are long BND, IXUS, VEU, VTI, VWO. (More…) I wrote this article myself, and it expresses my own opinions. I am not receiving compensation for it (other than from Seeking Alpha). I have no business relationship with any company whose stock is mentioned in this article. Additional disclosure: I am not a registered investment advisor or broker/dealer. Readers are advised that the material contained herein should be used solely for informational purposes, and to consult with their personal tax or financial advisors as to its applicability to their circumstances. Investing involves risk, including the loss of principal.

Whats Wrong With Emerging Markets ETFs?

Summary Major Emerging Markets ETFs (EEM & VWO) are investing in the “legacy economy” and not in the “new economy”. Government owned Chinese banks, Brazilian oil companies and Russian resource companies dominate major ETFs. BABA, BIDU, MELI, YNDX and other US listed EM E-commerce companies are NOT in EEM & VWO. What’s wrong with Emerging Markets ETFs? After years of poor relative returns investors have become disinterested and disenchanted with the leading Emerging Markets ETFs ( EEM , VWO ). While the U.S. stock market has made new highs and posted double digit returns, Emerging Markets haven’t done much, leading many investors to question the value of their Emerging Markets allocations. Adding to the woes are headline risks that are really in the headlines as revolution, war, fraud and corruption have either happened in the recent past or are happening right now. But maybe there is a bigger problem. In spite of all the turmoil and risk, Emerging Markets are growing. In fact they are growing at twice the pace of the U.S. and the rest of the developing world. And some countries and sectors within Emerging Markets are growing at quite spectacular rates. But why then aren’t the indexes and ETFs that track Emerging Markets performing better? A closer look at the indexes reveals some major flaws in the largest Emerging Markets ETFs. SOEs are Not Seeking Alpha Weighing most heavily on the indexes is their enormous allocation to state-owned enterprises (SOEs) which account for nearly 30% of the weight of the largest Emerging Markets ETFs. These companies represent the past of Emerging Markets, but not the future. The largest of these SOEs are Chinese, Brazilian and Russian state owned banks and oil companies. Many adjectives describe SOEs including, monolithic, inefficient, conflicted and corrupt. You don’t need not look far to see the problems with investing in SOEs. Recent news has been filled with reports of the investigation of top Brazilian government officials suspected of plundering state-owned oil giant PetroBras of over $1 billion in kickbacks and bribes. The Chinese government has launched a campaign to return 150 “economic fugitives” living in the U.S. who have fled China after allegedly looting or defrauding state owned businesses. And in Russia, where do you even start? Is South Korea Twice as Big as India? Less widely recognized are some of the other factors that can distort the indexes. Traditional index construction methodology uses market capitalization to determine weightings, an approach that in Emerging Markets tends to overweight countries with large banks and financial companies and small populations. As a result, countries like South Korea and Taiwan end up with about twice the weight of India in the major Emerging Markets despite the fact that India has 25 times the population of Korea and 50 times that of Taiwan. Does that make sense? (click to enlarge) Source: Big Tree Capital LLC (click to enlarge) Source: Big Tree Capital LLC How are 3.4 million Rich People 26% of “the Next Emerging Markets”? Things get even worse in so-called Frontier Markets indexes and ETFs. While often dubbed as “the next Emerging Markets” by the fund companies, Kuwait, with a population of only 3.4 million and per capita GDP on par with the U.S. comprises 26% of the largest Frontier Markets ETF (NYSEARCA: FM ). How much room for growth is there with 3.4 million rich people? Meanwhile, Nigeria, with a population of 173 million gets only a 10% weighting. (click to enlarge) Source: Big Tree Capital LLC (click to enlarge) Source: Big Tree Capital LLC Where the Growth is in Emerging Markets Most Emerging Markets investors know that the real growth opportunity in Emerging Markets is the growth of the consumer class. There are dozens of studies and reports published by investment banks, consulting firms and fund companies describing how billions of humans are moving from subsistence income levels to levels where they begin to consume more and better food, clothing, appliances, cars, etc. It’s a very good story. It’s a big story. In a report titled “Going for Gold in Emerging Markets” McKinsey & Co concludes that the growth of consumption in Emerging Markets is “the biggest growth opportunity in the history of capitalism.” Yet, in the major Emerging Markets ETFs, the consumer sector gets a meager 16% weighting. EEM & VWO are Missing the Best Part Finally and importantly, the major indexes and ETFs are largely missing out on something big that is just starting. As the Emerging Markets consumer wave hits, another wave has formed and is gathering momentum. All over the developing world, consumers are getting internet access via wifi and mobile broadband. At the same time, a new breed of manufacturers is offering smartphones for as low as $40. And prices are going to keep dropping. Consider the case of Xiaomi – a Chinese manufacturer of entry level smartphones. The company – which is less than five years old – will sell about 100 mm smartphones this year, up from 60 million units sold in 2014. In the next 5 years a billion consumers will emerge with a $40 smartphone in their hands. The result of this trend is significant revenue growth and value creation. Estimates are that Ecommerce in Emerging Markets has grown at an average of 41.5% for the past five years. And, while this rate is sure to slow, it still clocked an impressive 39.9% growth in 2014. (click to enlarge) Source: EMQQ Index Yet, Alibaba (NYSE: BABA ), MercadoLibre (NASDAQ: MELI ), Baidu (NASDAQ: BIDU ), JD.com (NASDAQ: JD ), Yandex (NASDAQ: YNDX ), 58.com (NYSE: WUBA ) and most of the 50+ publicly traded Emerging Markets Ecommerce companies benefiting from this growth are not in EEM or VWO because they choose to list on U.S. exchanges. The companies are essentially being “punished” from an indexing perspective for listing on the exchanges that will give investors greater liquidity and transparency than their “home” markets. In short, the major ETFs and indexes are leaving out the future. Investors Should Move On Investors using ETFs to gain exposure to Emerging Markets should re-evaluate their allocations. Using legacy indexes and ETFs that provide exposure to the entire universe of Emerging Markets companies may not be the best way to benefit from the growth of Emerging Markets. Investors should concentrate on identifying the Emerging Markets ETFs that provide them with targeted exposure to sectors and companies that are both growing and seeking to maximize shareholder value. Disclosure: I am/we are long EMQQ, BABA, BIDU, YNDX, WUBA, JD, MELI. (More…) I wrote this article myself, and it expresses my own opinions. I am not receiving compensation for it. I have no business relationship with any company whose stock is mentioned in this article. Additional disclosure: I have created an Emerging Markets Internet & Ecommerce Index. The index has been licensed as the basis for EMQQ The Emerging Markets Internet & Ecommerce ETF (NYSE:EMQQ). I receive a licensing fee from the ETF.

Revenue Growers In A Late-Stage Stock Bull

I cannot predict when fundamental valuation will matter again, or when economic weakness will create a panicky rush for the exit doors. What I do know is that fear of missing out eventually gives way to fear of loss. Several things become clear about corporate debt binges at record low rates and the subsequent use of cash to reclaim shares. There are a few ways in which an investor might attempt to circumvent the artificial earnings dilemma. Some facts are more disconcerting than others. For instance, top-line sales at S&P 500 corporations will decline for the second consecutive quarter for the first time since 2009. Equally discouraging? Roughly 70% of these companies (77/106) have reported negative profit-per-share outlooks. Meanwhile, earnings-per-share (EPS) prospects are expected to fall across the entire S&P 500 space. It follows that price-to-earnings (P/E) and price-to-sales (P/S) ratios will place stock assets at even more ridiculously overvalued levels. Few market participants care about the so-called fundamentals in late-state bull markets. Indeed, traditional metrics of stock valuation simply don’t matter (until they do) and complacency reigns supreme (until it does not). Those with extremely bullish biases attempt to spit shine the lusterless economy. However, the Federal Reserve itself downgraded its 2015 forecast for economic expansion. The downgraded pace that the Fed now offers is 1.8%-2.0% – a pace that is slower than the stimulus-stoked 2.1% achieved since the end of the Great Recession. In truth, bulls should hang their collective hat on the $2.7 trillion that S&P 500 corporations borrowed at ultra-low rates over the last past six years. These companies bought back their own stock shares at the highest percent-of-total-cash available since 2007. Several things become clear about corporate debt binges at record low rates and the subsequent use of cash to reclaim shares. First, companies are not particularly talented at judging when to plow dollars into the acquisition of their stock shares. They spent an ever-increasing percentage in the 2003-2007 stock market bull when they might have been better served to spend more modestly on shares and/or use the cash more productively (e.g., hiring, training, R&D, equipment, etc.). Moreover, they spent lower and lower percentages as the 2008-09 bear market raged on when acquiring shares during the bulk of the bear would have been far more favorable. Second, the primary use of stock buybacks has been to manipulate profitability perception. Companies reduce the number of outstanding shares in existence such that less supply of shares are available, even when demand is flat or waning; effectively, prices have a floor underneath them. What’s more, when there are less shares in existence, corporations appear more profitable than they really are. Now let us go back to the earlier reality that, earnings-per-share (EPS) are still expected to decline in Q2. So even with record levels of share buybacks, profitability per share will not rise. Nor will revenue. In fact, sales have been flat for years at many of the big-time Dow components and most in the media fail to highlight revenue shortfalls. There are a few ways in which an investor might attempt to circumvent the artificial earnings dilemma. One possibility is to rely on revenue generating firms, since sales-per-share is more difficult to manufacture than earnings-per-share. The RevenueShares Large Cap ETF (NYSEARCA: RWL ) weights each component of the S&P 500 by revenue rather than market capitalization. The RWL:S&P 500 price ratio below demonstrates that there may be value in overweighting top-line sales winners. One should recognize that outperformance in a bull market is less critical to long-term investing success than losing less in a bear market . Owning RWL won’t be of much service if the “fit hits the shan.” In other words, in an overvalued stock bull where there is high probability of a severe selloff in the not-so-distant future, one might wish to increase his/her allocation to assets on the lowest end of the risk spectrum. Consider employing the iShares 1-3 Year Credit Bond ETF (NYSEARCA: CSJ ), the SPDR Nuveen Barclays Short-Term Municipal Bond ETF (NYSEARCA: SHM ) and/or your money market account. Nobody knows when the global investing community will wake up. I certainly cannot predict when fundamental valuation will matter again, or when economic weakness will create a panicky rush for the exit doors. What I do know is that fear of missing out eventually gives way to fear of loss. The typical U.S. stock bear will destroy 30% of capital that is allocated to the asset class. That is the history of the financial markets. Those who don’t recognize 150 years of equity market activity are doomed to experience similar price depreciation. Raising cash when the prices are higher and buying when the prices are lower may be one’s best defense. Click here for Gary’s latest podcast. Disclosure: Gary Gordon, MS, CFP is the president of Pacific Park Financial, Inc., a Registered Investment Adviser with the SEC. Gary Gordon, Pacific Park Financial, Inc, and/or its clients may hold positions in the ETFs, mutual funds, and/or any investment asset mentioned above. The commentary does not constitute individualized investment advice. The opinions offered herein are not personalized recommendations to buy, sell or hold securities. At times, issuers of exchange-traded products compensate Pacific Park Financial, Inc. or its subsidiaries for advertising at the ETF Expert web site. ETF Expert content is created independently of any advertising relationships.