Tag Archives: energy

SolarCity – Why I’m Selling It And Buying First Solar

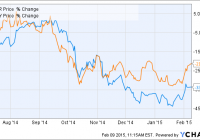
Summary SolarCity and First Solar stocks were highly correlated at the start of the fossil fuel price crash of 2014, but decoupled a few months ago. There may be an opportunity to hedge one stock against the other. SolarCity is highly speculative and will not make any profits for many years — if ever. First Solar is an established company with earnings. A pair trade could be a low-risk way to play FSLR and SCTY. Growth in solar energy has been tremendous and will almost surely be strong for the next several decades. According to seig.org (Solar Energy Industries Association): Today, the U.S. has an estimated 20 gigawatts [GW] of installed solar capacity nationwide, enough to effectively power nearly 4 million homes in the United States – or every single home in a state the size of Massachusetts or New Jersey – with another 20 GW in the pipeline for 2015 and 2016, according to SEIA and GTM Research projections. However, there have been major hiccups along the way including (but certainly not limited to) the whimsies of politics and fossil fuel prices. What if there was a way to invest in a solar stock that takes out the uncertainty of those hiccups and even the uncertainty of the overall market? There is a way. Last week I began a new mock portfolio here on Seeking Alpha: the Pairs Trade Portfolio; today I continue it with trades on SolarCity (NASDAQ: SCTY ) and First Solar (NASDAQ: FSLR ). A pair trade is a market-neutral hedge in which an investor essentially pits one company against another. Getting a return on a pair trade is not dependent upon a particular stock rising or falling necessarily, but dependent upon the relative price moves between two stocks (or other financial instruments). I won’t go into details about the hows and whys of pair trading here, as I have already described the theory in detail in a previous article. Please take a look at the link for more information on why pair trades might be a good investment. Correlation Since the start of the oil – and more importantly, natural gas – price crash, we can see from the chart below that First Solar and SolarCity stock prices had a high correlation for a few months before decoupling in early November as Solar City headed pretty much sideways while First Solar dipped substantially more. FSLR data by YCharts The change in correlation gives us our first clue that there might be an opportunity for a pair trade with these two stocks. Should SolarCity have outperformed First Solar? Time to dig a little deeper and see if we think FSLR is a relative bargain compared to SCTY. While the two companies are in the same industry and the stocks have had a high degree of correlation recently, the strategies of the companies could not be more different. SolarCity is pursuing fast growth financed by debt in the residential space while First Solar is a profitable vertically integrated manufacturer and utility-scale operator. Despite the differences in the companies, the macro events that often drive the stocks of most solar companies apply to both. The obvious recent example is the severe drop in fossil fuel prices, but there have been other factors in the past and there will undoubtedly be numerous factors in the future that affect both of these companies. Again, the pair trade largely insulates an investor from external macro events and focuses on one thing only: will one stock outperform the other? I think over the long haul First Solar will outperform SolarCity and below are some reasons. SolarCity: Show Me the Money When and how will SolarCity make money? That’s a big question for anyone interested in the stock and it is an impossible question to answer. At this point, the stock is pure speculation and the company is not expected to post a profit for many, many years. Well, how does one value the company then? SolarCity itself would like investors to focus on “retained value”. In a recent letter to shareholders a retained value number is prominently displayed as one of the highlights of the third quarter. In a presentation used in the third quarter conference call, the company had this slide to show: (click to enlarge) So what is retained value? SolarCity defines it as a discounted cash flow forecast from all megawatts booked as a contract. I won’t go into all of the assumptions that SolarCity makes to compute the retained value figure (much of which is unknown to the public), but I will hit some highlights. First, SolarCity assumes all contracts currently in place or booked to be installed will be renewed after 20 years. This is an outstanding assumption that is obviously flawed. 100% renewals will simply not happen, nor will all bookings even be installed. Second, the company assumes a discount rate of 6%. That is actually high at the moment, so one could argue that the retained value figure should, in fact, be higher than $2.2 billion. However, at some point rates will likely rise – perhaps substantially – and the 6% assumption could be far too low. Third, the company assumes that the technology will be current enough to warrant renewal for 10 years after the initial 20 year period. SolarCity states that the life expectancy of the equipment (not counting inverter replacement) used in its systems is “typically 30 years or more”. I’m going to go into that third point a bit more as I think it is particularly suspect. For one thing, solar panels degrade over time as the following shows: (click to enlarge) (Source: energyinformative.org ) Exact numbers over a long period of time are hard to come by since the vast majority of solar panels in existence have been installed quite recently. Based on my reading, I would estimate that the typical SolarCity customer could expect at least a 10% – 15% drop in power production at the end of 20 years. But more important is that the homeowner’s system will simply be obsolete in 20 years. Efficiency has increased dramatically in the last 20 years and will certainly continue to do so. I would not quite compare a 2015 solar system to using a computer from 1995…perhaps more like 2005. The hypothetical homeowner in 2035 is likely to be better off upgrading a system rather than renewing a lease on an outdated one. SolarCity wants investors to value the company based on this rather dubious metric of Retained Value. The simple fact that there are so many question marks around the computation makes me very nervous about it. Therefore, in my opinion, SolarCity’s retained value metric should be ignored and the company’s assumptions of future cash flows are highly speculative. The risks to the stock are huge. While shareholder’s in SCTY don’t seem to be too concerned about the present situation, let’s look at a more time-honored metric – current cash flow: SCTY Cash from Operations (NYSE: TTM) data by YCharts The above chart shows that the company has grown revenue at a rapid clip since going public but has also been burning through more and more money. Debt has increased substantially recently and will of course continue to do so for the foreseeable future. Right now SolarCity’s debt is financed at very low interest rates, but that could change over the next few years. And perhaps more importantly (and often overlooked by equity investors), it is debt holders that hold the reins to the company as pointed out in Barron’s : Founded in 2006, SolarCity has been consistently unprofitable. Most of its tax benefits and a portion of its future cash flows have been pledged to financing partners whose claims on the company are often senior to common shareholders’. If and when SolarCity begins to have positive cash flow, much of that money is pledged to go to the debt of the company. SolarCity received financing based upon its contract revenue and it has certain obligations to fulfill that exclude stockholders. First Solar: Oh, You Make Money? How Novel! Following up on the cash flow metric charted above, here’s a look at First Solar’s numbers: FSLR Cash from Operations ( TTM) data by YCharts First Solar is not exactly swimming in cash, but it has demonstrated a reasonable track record at generating some decent positive cash flow. In Q3 2014, the company posted an earnings per share of $0.87 and posted full-year guidance of $2.40 – $2.80. Based on 2015 analyst estimates of $4.52 per share, FSLR trades at a forward P/E of only 10.4. Conclusion SolarCity is certainly an interesting speculative play, but the key word there is “speculative”. Actually, the word “interesting” is somewhat key as well, as I prefer my investments to be as boring and predictable as possible. SolarCity is a wild card that may not come to fruition for decades, if ever. First Solar is clearly the lower risk play here. SolarCity is growing far faster, but is not making money doing so and might not ever make a profit. Here’s an interesting tidbit: in Q3 2014, SolarCity posted revenue of $58 million and First Solar posted revenue of $889 million — yet Solar City has a slightly higher market capitalization than First Solar. By going long FSLR and short SCTY, my strategy makes the viability of the solar industry as a whole a largely moot point. If the industry goes into the doldrums for the next 10 years it does not matter as long as FSLR outperforms SCTY. If the market tanks and takes these two stocks down to the single digits, it does not matter; as long as FSLR outperforms SCTY my trade will make money. The Portfolio I’m putting my fake money where my mouth is and buying FSLR and shorting SCTY in my Seeking Alpha portfolio as of about 1:20 pm Eastern Time on Feb 9. Here is what the mock portfolio looks like so far after one week (note that I plan on adjusting, adding, and updating this for years): (click to enlarge) Not much of note yet, but there will be more to come. Be sure to click “follow” if you would like to get real-time alerts on my future articles. Disclosure: The author has no positions in any stocks mentioned, and no plans to initiate any positions within the next 72 hours. (More…) The author wrote this article themselves, and it expresses their own opinions. The author is not receiving compensation for it (other than from Seeking Alpha). The author has no business relationship with any company whose stock is mentioned in this article.

El Paso Electric – A Regional Utility Worth Considering

Summary The utilities sector declined nearly 4% on Friday amid strong hiring news. El Paso Electric is now trading at under 18X earnings, cheaper than S&P 500 and Dow Utility Index. After a hiatus beginning in the late-1980s, El Paso Electric is again making dividend payments, including its most recently announced .28/share payment, its 16th straight quarter. Largest market is El Paso in Texas, which is viewed as a pro-business positive net-migration state. Decision not to participate in the renewal of aged coal power-generating plant reflects the modernization and commitment of the Company to provide sustainable long-term energy production. El Paso Electric (NYSE: EE ) is a regional electric utility company that provides generation, transmission, and distribution service to the southwestern United States and Northern Mexico. Its 10,000 square mile service area includes parts of Texas, New Mexico, and two connections to Juarez and the Mexican national utility, Comision Federal de Electricidad. The Company’s principal industrial and large customers operate in the steel production, copper, oil refining and defense industries (including Fort Bliss Army Base and White Sands Missile Range). El Paso Electric’s net dependable generating capability of 1,852 megawatts. Key events and catalysts – A substantial portion of the Company’s fossil fuel generation facilities are over 50 years old. Over the last five years, El Paso Electric has spent nearly $1 billion dollars for the replacement of plant and equipment and for additional generation, transmission and distribution. – El Paso Electric constructed its first new plan in nearly 30 years, a 288 MW Newman 5 natural gas-fired combined cycle plant – Additional cap-ex expected to top $1.5 billion in the next five years – Due to favorable location in high desert and reduction in cost of solar panels, El Paso Electric has introduced significant utility scale solar generation at costs competitive with fossil fuel alternatives – The Company’s Montana Power Station (a $372 million local generation facility) is expected to go on-line by summer of 2015 – El Paso Electric will not participate in extending the operation of the nearly five decade old coal-fired Four Corners Power Generating Station after its scheduled retirement in July 2016. – New Mexico rate case finalization in April 2015 and Texas rate case finalization in August 2015 will seek to recapture costs related to construction, load growth and facility retirement Service Area (Source Annual Report) (click to enlarge) While the population of the state of New Mexico grew a paltry 1.3% from April 2010 – July 2013 (compared the US as a whole – 2.4% – most recent data available from Census Bureau), the state of Texas grew 5.2%, more than double the national rate. Power Generation Station Primary Fuel Type Owned Net Dependable Generating Capacity (NYSE: MW ) Ownership Interest Location Palo Verde Station Nuclear 633 15.8% Wintersburg, Arizona Newman Power Station Natural Gas 732 100% El Paso, Texas Rio Grande Power Station Natural Gas 316 100% Sunland Park, New Mexico Four Corners Station (Units 4&5) Coal 108 7% Fruitland, New Mexico Copper Power Station Natural Gas 62 100% El Paso, Texas Renewables Wind/Solar 1 100% Hudspeth/El Paso Counties, Texas Total   1,852     (Source: Most recent annual report) Notes on power generation: – The Nuclear Regulatory Commission renewed the license of all operating units at Palo Verde which now expire between 2045 – 2047. – The estimated decommissioning costs related to the Palo Verde plant is $381 million. El Paso Electric’s trust fund had a $214 million at 12/31/13. – The 50-year participation agreement among the owners of the Four Corners Station expires in July 2016. El Paso Electric has informed the other owners that it has decided to cease it participation in the plant by July 2016 opting for more economical and cost effect energy alternatives. Customer growth Growth Rate Since 2009 Total growth: 29,335, 1.5% per year Residential growth : 25,482, 1.5% per year (click to enlarge) Customer growth has been positive since 2009, but at a very modest rate in total. Earnings per share EE Net Income (NYSE: TTM ) data by YCharts While earnings per share and net income are generally positive trending over the past decade, El Paso Electric has seen drop-offs in the last several years as decommissioning and other costs have outweighed rate and customer increases. El Paso Electric’s continued profitability hinges on its ability to successfully manage delivery and production costs in a rate-regulated environment. Last Friday, positive hiring news led to declines in “safe-haven” assets including gold, bonds and utilities stocks. El Paso Electric shares fell 4.34%, consistent with sector declines. The Company now trades at 17.72x TTM earnings , which is a lower multiple than the S&P 500 (20.03x) and the Dow Jones Utility Index (19.63x). Reliance on nuclear sourced power   2013 2012 2011 2010 2009 Nuclear 46% 46% 45% 45% 45% Natural Gas 34% 32% 30% 27% 22% Coal 6% 6% 6% 6% 7% Purchased Power 14% 16% 19% 22% 26% Nuclear power makes up a substantial portion of the Company’s sourced electricity. Despite the recoverability of fuel costs for nuclear power generation, it is still expensive and can result in additional regulatory costs associated with production, waste storage and disposal. The Company current sources less than 1% of its power from solar, wind and other renewable sources, but continued investment in these alternative energy sources can help El Paso Electric to remain profitable and competitive. Weather and energy (click to enlarge) (Source: Investor Presentation) Demand for energy is in part driven by climate and weather patterns. As show above, cooling degree days (CDD) dipped below their ten year average for the first time since 2008, while heating degree days (HDD) days are down to levels not seen since 2006. Assuming global warming is real , it is not unreasonable to expect larger and more frequent temperature swings which could drive demand for electricity. Selected Ratio and financial analysis (all information from morningstar.com unless otherwise noted) Ratios and metrics   TTM 2013 2012 2011 2010 2009 Gross margin % 65.6% 67.5% 70.5% 67.5% 66.7% 64.4% Operating margin % 16.3% 18.6% 19.8% 20.8% 19.3% 16.1% Debt/equity 1.12 1.06 1.21 1.07 1.05 1.11 Book value per share 24.13 23.51 20.57 19.10 19.10 16.51 The Company’s gross and operating margins have been fairly consistent, while maintaining a health debt/equity ratio and increasing tangible book value per share. One risk facing the El Paso Electric is the continued availability of debt and equity financing for construction and other projects. Cash flow and dividends   TTM 2013 2012 2011 2010 2009 Operating cash flow 237M 247M 273M 252M 239M 269M Capital expenditures 326M 289M 269M 236M 224M 252M Free cash flow -89M -42M 4M 16M 15M 17M Dividends 1.09 1.05 .97 .66 – – Operating cash flow has been on the decline since 2012, which is not what I look to see from a utility. The Company is investing in business, growing capital expenditures each year since 2010, which hopefully will result in more attractive power generation, distribution, and delivery mechanisms. As previously mentioned, prior to 2011, El Paso Electric had not paid dividends since 1989. Since the reinstitution its dividend policy, the company has grown the total payout each year since 2011. Understanding the Mexico opportunity While El Paso Electric serves a limited geographic (southwestern United States and northern Mexico), it has a fairly diversified customer base within this region. According to El Paso Electric’s most recent annual report, no customer makes up more than 4% of non-fuel base revenues. Most of the energy distributed to the Comision Federal de Electricidad is consumed in Juarez, a city of 1.5 million. While Juarez has a reputation for crime and violence, the city represnts a solid investment opportunity for El Paso Electric as it has nearly doubled in population since 1990. Continued growth and modernization of Juarez will be a long term benefit to El Paso Electric’s bottom line. Leadership El Paso Electric announced Thursday that Chairman of the Board Michael Parks resigned to accept a job with a global investment management firm. Parks served on the board since 1996. He was replaced by long-time board member Charles Yamarone as the new chairman. Bottom line If I was looking for a moderate risk/reward small cap utility play, I would be satisfied owning El Paso Electric at current prices. It has a reasonable 2.8% forward yield , conservative 50% payout ratio, and is taking steps to move away from dirty energy and to cleaner renewable sources. There are a substantial number of utilities that offer higher yield, a longer and more consistent dividend history, and more years of profitability. El Paso Electric may be the right stock for your portfolio, but not the right stock, right now, but if you are on the fence and need a sign, put it on your watch list, and consider scaling into a position when any of the following occur: – Alternative energy as a percentage of net dependable generating capacity exceeds 10% of total. This would mean El Paso Electric has entered a new era of largely clean (natural gas and alternative) energy generation that could be a competitive advantage when the freeze-period expires and competition is introduced into EEs Texas service area. – Yield rises to 5% (but payout stays same or increases). For this to occur, El Paso Electric would need to be trading at $22.40 per share, or a dirt cheap 10.2X earnings. – All Coal and Nuclear operations are ceased and all decommissioning costs settled and final. This would remove substantial uncertainty and potential earnings volatility for intermediate horizon investors (3 – 5 years). Disclosure: The author has no positions in any stocks mentioned, and no plans to initiate any positions within the next 72 hours. (More…) The author wrote this article themselves, and it expresses their own opinions. The author is not receiving compensation for it (other than from Seeking Alpha). The author has no business relationship with any company whose stock is mentioned in this article.

The Weakness In The Natural Gas Market Persists

Summary The price of UNG kept coming down last week. The low extraction from storage is related to the warmer-than-normal weather. The recent rally in oil didn’t bring UNG back up. The recent recovery in the oil market didn’t provide any back-wind for The United States Natural Gas ETF, LP (NYSEARCA: UNG ) that kept coming down in the past week. The Energy Information Administration reported another lower-than-anticipated withdrawal from storage. (Data Source: EIA, Google Finance) The chart above presents the normalized prices of natural gas and UNG since the end of November 2014 till date – over this time frame, UNG fell by 38% and natural gas by almost 37%. This modest gap is due to roll decay attributed to the contango in futures markets. For now, the markets are still in contango, which means this gap between UNG and natural gas prices is likely to further widen in the coming months. But this also suggests that the market expects natural gas prices to start picking up again in the coming months. The EIA reported another lower-than-expected extraction from storage of 115 Bcf. In comparison, the extraction last year was 270 Bcf and the 5-year average was 165 Bcf (as a side note: these comparisons are only intended to provide crude base lines – after all, they also entail a lot of noise (as is the case in any weekly comparison), and as such, we should put an asterisk next to these base lines). The ongoing lower-than-expected extraction from storage may have rendered another blow to UNG this week. Most of the shifts in storage this time of the year are related to changes in weather. The relation between the changes in storage compared to the 5-year average and the shifts in temperatures from normal has remained strong this winter – the linear correlation is still at 0.74, which means the R-square is around 54% (this result in based on certain assumptions, including linearity and normality – two assumptions that might not hold up under scrutiny). This result only tends to show that the ongoing warmer-than-normal winter, on a national level, has kept the extraction from storage lower than normal for this extraction season. On top of this, the current storage level is around 24% higher than only 1.2% below the 5-year average. So the lower extraction, along with relatively normal storage levels has been enough to bring down the price of UNG to its current low levels. (Data Source: EIA , National Climate Data Center ) Last week’s deviation from normal temperatures was 6.38. So for next week’s storage report, the extraction from storage is likely to be, yet again, lower than the 5-year average, which was 165 Bcf. The ongoing low withdrawal is likely to bring storage to even slightly higher-than-normal levels in the coming weeks. Over the next couple of weeks, the weather is still projected to be colder than normal in the east and hotter than normal in the west. For February, the recent monthly report of the National Oceanic and Atmospheric Administration predicts above-normal temperatures in many parts of the U.S., except for certain regions such as the Northeast. But the weather forecast still entails uncertainty mainly related to a potential El Nino. But for now, it seems hard to see how UNG will start to pick up again to its high levels unless the weather starts to get much colder than it is now. After all, even the recent recovery in oil prices didn’t bring natural gas up. The recent news from Baker Hughes of the sharp drop in oil rigs has influenced oil inventors to adjust (or speculate on) their expectations about changes to the U.S. oil supply. This news brought oil prices back up in the past week. Oil rigs have declined by 83 rigs last week, and by a total of 276 rigs in the past year. But this rally didn’t seem to have much of an impact on natural gas prices, which only kept coming down. After all, gas rigs slipped by only 5 in the past week to reach 314. The uncertainty in the weather forecast for February could imply high volatility in the natural gas market. If the withdrawal from storage continues to be lower than normal, this could keep the price of UNG down. For more see: ” Has the Weakness in Oil Fueled the Decline of UNG? ” Disclosure: The author has no positions in any stocks mentioned, and no plans to initiate any positions within the next 72 hours. (More…) The author wrote this article themselves, and it expresses their own opinions. The author is not receiving compensation for it (other than from Seeking Alpha). The author has no business relationship with any company whose stock is mentioned in this article.