Tag Archives: energy

Pattern Energy Group: Questionable Acquisitions, And Dividends Funded By Capital Raises

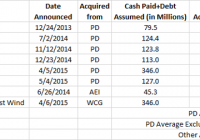
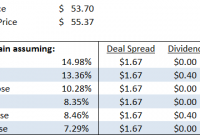
Dividends are increasing despite shrinking Cash Available For Distribution, earnings estimates falling considerably, and increasing share count. PEGI’s parent company, Pattern Development, is dumping shares while selling assets to PEGI at higher and higher prices and sharing a CEO and other executives with PEGI. PEGI’s acquisitions from PD and the dividends are funded by public offerings which are dependent on dividend-hungry investors. Something has to give. Pattern Energy Group (NASDAQ: PEGI ) is an “independent power company focused on owning and operating power projects … [they] hold interests in twelve wind power projects located in the United States, Canada and Chile that use proven, best-in-class technology and have a total owned capacity of 1,636 MW.” Pattern is part of a recently developed genre of so-called “YieldCos”, which also includes companies like TerraForm Power (NASDAQ: TERP ), Abengoa Yield (NASDAQ: ABY ) and Nextera (NYSE: NEP ). These companies generally buy energy projects from a parent company and then distribute the proceeds from their operations as dividends. There are three things about Pattern that in my eyes sets them apart from other YieldCo’s. Any of these things individually isn’t necessarily a problem, but together they paint an interesting picture: Their portfolio is exclusively (with one small exception) wind energy projects and thus more susceptible to irregular weather patterns like El-Nino. Pattern’s parent has only a 25% (and shrinking) ownership interest in Pattern. Pattern shares executives with their parent company. This article is nothing more than a close reading of PEGI’s 2014 10-K. ( https://www.sec.gov/Archives/edgar/data/1561660/000119312515073104/d842437d10k.htm ). Let’s get to the 10-K, where PEGI discusses another company, Pattern Development (I will refer to them as PD): We are party to the Management Services Agreement, pursuant to which each of our executive officers (including our Chief Executive Officer), with the exception of our Chief Financial Officer and Senior Vice President, Operations, is a shared PEG executive and devotes time to both our company and Pattern Development as needed to conduct our respective businesses. As a result, these shared PEG executives have fiduciary and other duties to Pattern Development. Conflicts of interest may arise in the future between our company (including our stockholders other than Pattern Development) and Pattern Development (and its owners and affiliates). .. Pattern Development’s general partner and certain of its officers and directors also have a fiduciary duty to act in the best interest of Pattern Development’s limited partners, which interest may differ from or conflict with that of our company and our other stockholders. Emphasis mine. PEGI and PD share a CEO and other officers. This may be a problem since PEGI acquires power projects from PD. In fact, acquiring from PD is PEGI’s stated growth strategy. It is also worth noting that many of their executives immediately before Pattern worked at Babcock and Brown, an investment firm that went bankrupt in 2009. Our growth strategy is focused on the acquisition of operational and construction-ready power projects from Pattern Development and other third parties that we believe will contribute to the growth of our business and enable us to increase our dividend per Class A share over time. We expect that our continuing relationship with Pattern Development, a leading developer of renewable energy projects, will be an important source of growth for our business. I have assembled the data about Pattern’s acquisitions. Here is what I have observed: (click to enlarge) As you can see, they are generally pretty fair regarding prices paid to PD versus prices paid to other parties, with one giant exception, that being K2 which was announced in early April of this year. The average price paid to PD per MW of the above is $1.09M. The average price paid to others is $0.97M, and the average price paid to PD, excluding K2, is $0.76M. In other words, the recent K2 acquisition sticks out like a sore thumb and I would be curious to know their rationale for paying such a high price, especially given that it is the largest acquisition in absolute dollars as well as $/MW but one of the smallest in terms of MW of capacity acquired. Maybe they got a high $/MWh power purchase contract out of it. I should note that $/MW isn’t the end-all-be-all of metrics, but it’s all we have, and as Berkshire Hathaway’s Charlie Munger has said, roughly, “If we see someone who weighs 300 pounds or 320 pounds, it doesn’t matter-we know they’’re fat.” The cost paid per MW for acquisitions from PD has steadily risen, whether we include K2 or not: Meanwhile, PD is dumping PEGI shares while PEGI does public offerings. Additionally, PD is using their PEGI shares as margin on a loan: In May 2014, we completed a follow-on offering of our Class A shares. In total, 21,117,171 Class A shares were sold. Of this amount, we sold 10,810,810 Class A shares and Pattern Development, a selling stockholder, sold 10,306,361 of our Class A shares . In addition, in February 2015, we completed another follow-on offering of our Class A shares. In total 12,000,000 Class A shares were sold. Of this amount, we issued and sold 7,000,000 Class A shares and Pattern Development, a selling shareholder, sold 5,000,000 of our Class A shares … …In addition, on May 6, 2014, Pattern Development entered into a loan agreement pursuant to which it may pledge up to 18,700,000 Class A shares to secure a $100.0 million loan . If Pattern Development were to default on its obligations under the loan, the lenders, upon the expiration of certain lock-up agreements, would have the right to sell shares to satisfy Pattern Development’s obligation. Such an event could cause our stock price to decline… Last year, PEGI paid about $52M in dividends. This year, they converted their Class B shares to Class A, and issued more class A shares as mentioned above, so they’ll have to pay more in total dollar terms for the same amount of dividends per share. They recently reported Q1 2015 quarterly Cash Available for Distribution (CAFD) of $9M and announced a quarterly dividend of around $23M. Thus, CAFD as they define it wasn’t enough to cover their recent dividend. On the recent conference call, they mentioned that they have some “CAFD-like” cash-flows that aren’t included in CAFD but can be used to cover the dividend. This seems to me to be “moving the goalposts” but it is perfectly possible that it is the case. PEGI’s earnings have been consistently below estimates, and their future earnings estimates are falling considerably, creating doubt in my mind that they can hit their growth targets. The following shows their Q4 2014 calculation of “Cash Available For Distribution”, or CAFD, which they just announced will grow at a 12-15% CAGR for the next 3 years ( http://files.shareholder.com/downloads/AMDA-25NBHH/80126018x0x814874/0629F770-71BB-47FE-83CD-658E363DCA8B/03.03.15_PEGI_presentation.pdf ): (click to enlarge) You will notice that in their calculation of Cash available for distribution, they account for Operations and Maintenance (O&M) capex. Somehow, this may not be enough to maintain their operating performance. From the same document: However, cash available for distribution has limitations as an analytical tool because it excludes depreciation and accretion, does not capture the level of capital expenditures necessary to maintain the operating performance of our projects , is not reduced for principal payments on our project indebtedness except to the extent it is paid from operating cash flows during a period, and excludes the effect of certain other cash flow items, all of which could have a material effect on our financial condition and results from operations. Emphasis mine. If “O&M capex” isn’t enough to maintain the operating performance, then either they are skimping on O&M capex, or more capex should be considered O&M capex for their calculation of CAFD. Either way, by their own admission, CAFD doesn’t reflect the amount of CapEx necessary to maintain operating performance. Long term, wind energy is of questionable value compared to solar in my view. However, Pattern has locked in fixed purchased power agreements where they get to sell all of the power produced at a price that either is fixed or escalates with CPI. Thus, they have protected themselves from falling electricity demand. On the flip side, if demand rises they don’t have pricing power. Fixed prices are not advantageous if inflation ever picks up, since their costs would rise much faster than revenues. Near term, there are not major threats to wind production, but in the very long term, distributed solar generation could make it difficult for utilities to add more fixed purchased power contracts, or to follow through with their fixed power purchase contracts. The cost of solar power decreases (see Swanson’s Law ) by roughly one-half every 10 years. Wind energy does not have the same advances in efficiency: There may be a time in the future where solar power is efficient to the point that wind power is rendered too expensive to use, the cash flows from wind projects may not run as far into the future as expected when they are built. One last interesting bit I noticed in the 10-K: Our proportional MWh sold in the year ended December 31, 2014 was 2,914,810 MWh, as compared to 1,771,772 MWh in the year ended December 31, 2013, representing an increase of 1,143,038 MWh or approximately 65% . This increase in proportional MWh sold during 2014 as compared to 2013 was primarily attributable to the commencement of commercial operations at South Kent, El Arrayán, Panhandle 1 and Panhandle 2 at various times during the year and an increase in production from an additional 42 MW at Ocotillo for the full year of 2014. Our average realized electricity price was approximately $88 per MWh during the year ended December 31, 2014 as compared to approximately $88 per MWh in the prior year. Between 2013 and 2014 prices per MWh remained constant while proportional MWh sold increased a whopping 65%! However, as far as I can tell, no meaningful part of their revenue grew 65%. Perhaps they use a simple average rather than a weighted average, but that wouldn’t make sense in my view. In conclusion, while the ~5% dividend yield may look attractive, it would be inadvisable to buy this stock for a sustained dividend, in view of the above. There are of course risks to the concerns raised in this article. It is possible that the wind picks up substantially, they are able to generate enough cash from their new acquisitions to sustain the dividend, they can tap the capital markets to cheaply raise more cash, and that the amount of capex necessary to maintain operating performance is negligibly larger than the O&M capex they use to calculate CAFD. Perhaps they are able to diversify into more solar projects. Trading at over 7x Sales, though, a lot has to go right to justify their valuation in my view. I reached out to their IR department through their website about conflicts of interest, the Conflicts Committee, their acquisitions, O&M Capex, and why revenues didn’t grow as much as Average Price times MWh sold. I received no response. Disclosure: The author is short PEGI. (More…) The author wrote this article themselves, and it expresses their own opinions. The author is not receiving compensation for it (other than from Seeking Alpha). The author has no business relationship with any company whose stock is mentioned in this article.

Despite Slow First Quarter, Duke Energy Remains A Safe Dividend Play

Summary Duke Energy’s first quarter 2015 EPS of $1.24 beat estimates by $0.10, while Revenue of $6.06 billion missed expectations by $240 million. The company’s residential retail energy market declined as a result of more efficient energy practices and the company’s international business segment declined due to issues n Brazil. I believe Duke Energy stock presents a safe dividend play with opportunity for slow stock appreciation going forward. On May 1, 2015, Duke Energy Corporation (NYSE: DUK ) reported their first quarter of 2015 earnings results and provided an update on their four financial objectives for 2015 and beyond-(1) current year earnings guidance, (2) long-term earnings growth, (3) dividend growth, and (4) balance sheet strength. In this article, I will review the company’s four financial objectives and analyze their progress in obtaining them. Achieve 2015 earnings per share within guidance range of $4.55 and $4.75 Capital expenditures are expected to fall within the range of $7.4 and $7.8 billion for the year. In the first quarter of 2015, the company had $1.45 billion in capital expenditures putting the annualized projection to $5.8 billion. While the capital expenditures projection is lagging behind projections, management expects the economic development usage of the expenditures to result in almost 3,000 new jobs as the company makes commitments to pursue alternative energy generation sources. The company saw retail load growth of 0.5% to 1.0% for the year. The weather normalized retail growth rate decrease 0.2% year-over-year largely due to the 2014 polar vertex. The strong performance in the industrial market was offset by the disappointing residential market performance. The residential market experienced lower usage year-over-year due to changes in energy efficiency and conservation, polar vertex in 2014, and higher use of multi-family housing. There were 700M average shares outstanding at 12/31/2015. The company had 708M outstanding shares at 3/31/2015, up from 707M at 12/31/14. The company does not have any planned equity issuances through 2017. We saw $65 per barrel average Brent crude price for 2015. Oil price projections have remained consistent to projections as the expected Brent crude oil prices have increased from EIA’s February 2015 report of $57.56 to $61 in May 2015’s report . The joint venture, National Menthol Company (NMC), which runs through 2032, is 25% owned by Duke Energy. NMC’s earnings are positively correlated with crude oil prices and an approximate $10 per barrel change in the average annual price of Brent crude oil has roughly a $0.01 to $0.02 EPS impact annually. There was an exchange rate of approximately 2.85 BRL/US dollar. The exchange rate has increased above this expected rate to $3.01 on 5/13/2015 as the Brazilian economy struggles and the US economy rebounds. The continued drought conditions, struggling Brazilian economy, and weaker foreign currency exchange rates are the largest factors behind the $0.13 year-over-year quarterly earnings per share decline in the company’s international segment. The ongoing drought in the country has caused the company to dispatch higher cost thermal generation instead of the low cost hydro generation. Additionally, the struggling economy has caused the company to lower demand growth for 2015 between 0% and 2%, which is much lower than the greater than 3% seen over the past several years. Deliver earnings per share growth of 4% to 6% through 2017 There was retail load growth of 1% going forward. The company has been stagnant with a 0.6% retail load growth from 2012 and 2014. As seen by the decrease in the first quarter of 2015, I think it is going to be very difficult for the company to achieve a 1% growth going forward. I think it is going to be difficult to achieve because of the lower energy usages in homes. I don’t see this trend reversing and allowing this 1% growth rate to be achieved. The company expects total wholesale net margin to increase due to the new 20-year contract with NCEMC at Duke Energy Progress (began in 2013) and 18-year contract with Central EMC at Duke Energy Carolinas growing to a load of 900MW in 2019 from 115MW in 2013. FY2015’s total wholesale net margin is expected to be approximately $1.1 billion with an anticipated 5% compound annual growth rate. The regulated earnings base growth is expected to follow the $2 billion growth trend in 2015 that was seen in 2014. Continue growing the dividend within a 65% to 70% target payout ratio On May 7, 2015, Duke Energy declared a quarterly cash dividend of $0.795 per share, in line with previous quarterly dividends. Management expects the dividend to rise to $3.24 per share in 2015 (almost 2% increase year-over-year). With the Company achieving a payout ratio close to 70% and management’s commitment to paying out a quarterly dividend to investors, I do not see the company’s current 4% dividend yield to be at risk. Management has paid 89 consecutive years of dividends with increases coming the past 7 years. This is largely possible due to the Company’s strong balance sheet and no planned equity issuances through 2017. In addition, the company announced a strategically tax-efficient way to repatriate $2.7 billion back to the U.S. during the fourth quarter 2014 earnings call, which will help fuel the dividend increases going forward. Maintain strong, investment-grade credit ratings. While the company’s credit rating was recently upgraded by S&P, I believe there are three primary risks for the company going forward. The exposure to Brazil is a significant risk for the company’s future, which was seen in the 2014 financial results. In 2014, there was a decrease in sales volume as well as higher purchased power costs due to the interruptions in the hydrology production. Per the earning’s call, they are assuming normal hydrology despite the rainy season starting slowly. Brazil is a major story to follow for Duke Energy in 2015 and beyond as the Company is predicting EPS growth from this business segment despite recent downward trends in profits there as well as the Brazilian economy. I think the company will have difficulty increasing the retail load growth to 1% given the increased technologies and social initiatives to decrease electric use. Oil prices will continue to be a wild card going forward. Forecasting a price on such a volatile asset is a difficult task. If oil prices continue to fluctuate widely, it will significantly impact the company’s bottom line. Conclusion Duke Energy faces some difficult obstacles including a slowing Brazilian economy, lower residential energy usage, and volatile oil prices; however, I believe that the company gave conservative and very obtainable estimates in each of the key assumptions used to allow them to meet their financial objectives for FY 2015 and beyond. While I don’t see Duke Energy being a rapid growth story going forward which can be seen in the lagging capital expenditures, I do believe they have the ability to present slow stock appreciation with the safety of a consistent dividend. Disclosure: The author is long DUK. (More…) The author wrote this article themselves, and it expresses their own opinions. The author is not receiving compensation for it (other than from Seeking Alpha). The author has no business relationship with any company whose stock is mentioned in this article.

Cleco Merger Arbitrage Offers Low-Risk 13% Annualized Return

Summary Investors can earn a low-risk 13% annualized return by purchasing the stock at today’s price and waiting for the transaction to close. Mr. Market doesn’t appear to be properly accounting for the merger agreement, which calls for CNL to continue to pay its sizable dividend while shareholders wait for closing. CNL shareholders have already voted on and approved the transaction by a wide margin. Anyone who follows our work knows our typical modus operandi focuses on finding undervalued contrarian investments that offer asymmetric risk/reward opportunities. While we firmly plan to “stick to our knitting,” we occasionally look to supplement our returns with low-risk, high-return (relatively speaking) merger arbitrage opportunities. As Warren Buffett once said: “Give a man a fish, and you feed him for a day. Teach him how to arbitrage and you feed him forever.” We see a compelling risk/reward profile for a merger arbitrage trade of Cleco Inc. (NYSE: CNL ). We believe an investor can earn a low-risk 13% annualized return by purchasing the stock at today’s price and waiting for the transaction to close. Our analysis suggests there is a low probability of the deal not consummating. This outsized return opportunity exists because Mr. Market does not appear to be properly accounting for the merger agreement, which calls for CNL to continue to pay its sizable dividend while shareholders wait for the deal to close. Company overview Cleco Corporation is a regulated electric utility company headquartered in Pineville, Louisiana. CNL is engaged principally in the generation, transmission, distribution, and sale of electricity, primarily in Louisiana. Cleco Power owns 11 generating units with a total nameplate capacity of 3,340 megawatts. Cleco Power serves approximately 286,000 customers in Louisiana through its retail business, and it supplies wholesale power in Louisiana and Mississippi. The Deal On October 20, 2014, CNL announced that it had entered into an agreement to be acquired by an investor group led by Macquarie Infrastructure and Real Assets, British Columbia Investment Management Corporation, and John Hancock Financial. Under the terms of the definitive merger agreement , the investor group will acquire all outstanding shares of CNL for $55.37 per share in cash. The merger agreement also calls for CNL shareholders to continue to receive the sizeable dividend payments until the deal closes. CNL pays a quarterly dividend of $0.40 per share, which equates to a 3.00% yield based on today’s closing price. 10/20/2014 merger press release: “Prior to closing, the transaction is expected to have no impact on Cleco’s dividend. Cleco shareholders will continue to receive dividends at an annualized rate of $1.60 per share until closing.” The Payout We believe an investor can earn a 13% annualized return by purchasing the stock at today’s price and waiting for the transaction to close. With the stock currently trading at $53.70, the relatively large deal spread combined with an attractive dividend payout presents a compelling risk/reward opportunity for a merger arbitrage trade. This outsized return opportunity exists because Mr. Market does not appear to be properly accounting for the merger agreement, which calls for CNL to continue to pay its sizable dividend while shareholders wait for the deal to close. The table below shows that CNL will pay a dividend in August and November if the transaction has not closed by then. The column titled “Total Profit” shows the cumulative profit that will accrue to an investor under the different closing dates. Our estimated annualized return is based on our expectation that the transaction will close by the end of August 2015. We think this is a reasonable estimate based on our research (details below). Keep in mind that the longer the deal takes to close, the lower the annualized return will be because of the time component of the calculation. Low-risk Transaction We believe the CNL transaction has a high probability of closing for the following reasons: – Modest deal size, all cash deal: This transaction is of average size and it calls for the Investor Group to pay CNL shareholders in cash. Given today’s accommodative lending environment, we believe the Investor Group will easily be able to raise the necessary funds. – Shareholder support: CNL shareholders have already voted on and approved the transaction by a wide margin. The merger proposal passed with more than 94% of the votes cast. – Termination fee: The merger agreement calls for the Investor Group to pay CNL $180m if they fail to close the transaction. – Fair valuation for the deal: Regulated utility assets are attractive in a world with extremely low interest rates. Furthermore, M&A activity has led to regulated utility assets becoming increasingly scarce. We analyzed the CNL transaction versus recent comparable deals and found the valuation multiples to be consistent with what investors have been willing to pay for similar assets. (click to enlarge) Source: FactSet Should the deal fail to close, we believe CNL could be sold to a different party for a similar price. This view is based on the recent history of CNL and how the current merger agreement came about. In June 2014, CNL received an unsolicited bid from the Canadian investment group, Borealis Infrastructure. In response, CNL retained Goldman Sachs to run a formal sale process. At the time, press reports said the company was seeking a deal in the range of $61-62 per share. Our research indicates that four different parties made serious overtures for CNL: Macquarie Group, Iberdrola, Borealis Infrastructure, and CenterPoint Energy. Regulatory Approvals Needed CNL still needs to receive the following regulatory approvals before the transaction can close: 1) Hart-Scott-Rodino Antitrust approval: We view this approval as a formality. The Investor Group acquiring CNL is a financial buyer and has no other competing businesses in the operating footprint. The application has already been filed. 2) Federal Communications Commission approval: We think approval of license transfers is a formality. CNL expects to file the application this quarter. 3) Foreign Investment in the United States approval: We think this approval is a formality. The financial buyers are from Canada and Australia. CNL expects to file the application this quarter. 4) Federal Energy Regulatory Commission approval: We expect a timely approval by FERC given the Commission’s stance on similar M&A transactions over the years. The application has already been filed. 5) Louisiana Public Services Commission approval: We expect this approval to take the longest but we believe the LPSC will grant an approval given the accommodative concessions made by the acquiring Investor Group. These concessions include promises to maintain employment levels and employee compensation, a commitment to appoint individuals from Louisiana to the board of directors, and a vow to remain operated by local management and headquartered in Pineville, Louisiana. The merger application was filed with the LPSC in February with a status hearing last month. We analyzed past utility deals that have occurred in Louisiana and found that historically the LPSC has approved these types of transactions (despite the occasional saber rattling). Perryville Energy Partners LLC, Dolet Hills Power Plant Operations, and Cajun Electric Power Cooperative Inc. are all examples of utility transactions that have been allowed to proceed. Utility Transactions Historically Take ~250 Days to Close We analyzed the group of comparable utility transactions cited above and found that average “days to close” was 258 days. It has been 204 days since the definitive agreement was announced. If the transaction closes at the end of August, like we expect, it will be 314 days, which seems reasonable compared to industry history. (click to enlarge) Source: FactSet Conclusion We see a compelling risk/reward profile for a merger arbitrage trade of CNL. We believe an investor can earn a low-risk 13% annualized return by purchasing the stock at today’s price and waiting for the transaction to close. Our analysis suggests there is a low probability of the deal not consummating. This outsized return opportunity exists because Mr. Market does not appear to be properly accounting for the merger agreement, which calls for CNL to continue to pay its sizable dividend while shareholders wait for the deal to close. Should this transaction fail to close, we don’t think investors would suffer a permanent impairment of capital as CNL could likely sell itself for a similar price to a different party. Disclosure: The author is long CNL. (More…) The author wrote this article themselves, and it expresses their own opinions. The author is not receiving compensation for it (other than from Seeking Alpha). The author has no business relationship with any company whose stock is mentioned in this article. Additional disclosure: The author and/or employer may buy or sell shares in any company mentioned, at any time, without notice. The information contained herein is believed to be accurate as of the posting date. Readers should conduct their own verification of any information or analyses contained in this report. The author undertakes no obligation to update this report based on any future events or information. This article represents best efforts to convey a fact-based opinion. Our conclusions may be incorrect. This is not a recommendation to buy or sell any securities. This document does not in any way constitute an offer or solicitation of an offer to buy or sell any investment, security, or commodity discussed herein or of any of the affiliates of the Author.