Tag Archives: energy

NRG Energy – A Business Pivot At Just The Right Time

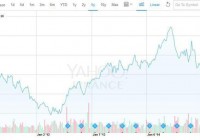
Summary There are major trends impacting the Utility sector: Fuel fluctuations, renewable energy targets, increasingly connected customers and innovations in distributed generation. The interest rate environment is favorable for highly leveraged Utility companies to refinance at attractive rates. NRG is using this drawdown period to shift their business to benefit from these trends in the future. The utility sector is going through a period of margin compression and market disruption which is challenging for a group of companies which are expected to pay stable dividends. The sector is being impacted by changing trends in renewable energy, increasingly connected retail customers, fluctuations in fuel costs and the increasing economic validity of distributed generation. NRG (NYSE: NRG ) is using this challenging business environment and the current low interest rates to pivot all of the Company’s businesses to benefit from these trends going forward. Make no mistake, NRG is undergoing major restructuring of their business model. The Company taken a hard look at all facets of the company and is making broad changes. One major change is that NRG has reorganized their company organizational structure, which is summarized in the Business Overview section below, to fit their view on trends in the Utility sector. Another major change is how NRG is approaching regulatory risks regarding the environment. 31% of NRG’s generation fleet is “dirty” coal-fueled power plants, the Company is currently burning cash upgrading these plants to bring them on pair with cleaner Combined Cycle Gas Turbine plants which are fueled by Natural Gas. The bottom-line benefits of the coal plant upgrades have yet to be seen. By analyzing the NRG’s current business environment, future trends in the sector, growth plan, risk management strategy and expert opinions we can tentatively postulate that the Company will produce sub-par results in the near-term, but has positioned itself as a Utility sector leader in the long-term. (click to enlarge) *from Yahoo Finance Business Overview: NRG Energy, Inc. is a competitive power company that produces, sells and delivers energy and energy products and services in major competitive power markets in the United States. Further the Company is a leader in the Utility sector and is 48th in the Fortune 100 Largest Companies in the United States. NRG owns and operates around 52,000 MWs of generation and engages in trading of wholesale energy, capacity, fuel and transportation services. Further the Company directly sells energy and sustainable services to retail customers. There are three major grouping within NRG: NRG Business: Was traditionally known as the Wholesale Power Generation Business, but now also includes business-to-business solutions. These solutions include, demand response, commodity sales, energy management and energy efficiency. Further this branch includes the distributed generation team for NRG. NRG Home: Is the consumer facing retail power operations, including solar. The branch serves 2.8 million recurring customers and is the largest retail energy provider in Texas and one of the largest in the United States. NRG Renew: The branch of NRG which develops mirco grid solutions as well as renewable products and services for large clients. In 2014, NRG Renew became one of the largest domestic wind-operators after an acquisition from EME . NRG Yield: A publicly traded dividend growth-oriented company formed to serve as the primary vehicle through which NRG owns operates and acquires contracted renewable and conventional generation. NRG Carbon 360: Consists of the Company’s carbon capture business. The branch plans to develop carbon capture technologies for NRG with an aim to prolong the life of NRG’s coal fleet and convert the carbon emissions to a marketable asset. (click to enlarge) * from 10-k Trends: The NRG has stated that the U.S. energy industry is going to be increasingly impacted by a long-term societal trend towards sustainability. Further the company stated that the information technology revolution, which has enabled greater personal choice, will increase churn in the U.S. retail energy sector. The sector specific trends above need to be considered in context with two current trends in the Natural Gas Market and Credit Markets which directly impact NRG’s business results. The Natural Gas Market has been in a downward price trend since its peak in 2007. While it might seem counter intuitive, downward Natural Gas prices actually reduce margins for NRG’s power generation portfolio, this relationship is explained further in the Risk Management section below. If Natural Gas reverse trend and begin rising, NRG will see an expansion of margins from their generation fleet. (click to enlarge) * Henry Hub Natural Gas Prices, Monthly from WSJ The Credit Markets have been in a decreasing interest rate environment since 2007. Like many Utilities, NRG is heavily leveraged, which means the company has significant exposure to interest rate risk, these risks are explained further in the Risk Management section below. If the Credit Markets reverse their trend and NRG cannot hedge adequately, the Company will be forced to devote much of their operating capital to debt repayments. (click to enlarge) *from the US Treasury Database Growth Plan: from the 10-k Enhance Generation: Continue to invest in upgrading the Company’s coal-fueled generation fleet. Expand Retail : NRG has increased its exposure to the Texas retail energy market in order to gain access to the competitive pricing structure of the ERCOT market. Further the company is diversifying its retail brand names to capture more segments of the market. Go Green: The company recently acquired the largest wind farm in north America. See it here . Smart Capital Allocation: NRG has hedged a portion of its coal and nuclear capacity with decreasing hedge levels through 2019. As a result of the GenOn aquisition , the majority of the Company’s generation is in forward capacity markets that extend three years into the future. As of December 31, 2014 the Company had purchased fuel forward under fixed price contracts, for approximately 50% of its expected coal requirement from 2015 – 2019. Risk Management: from the 10-k Many of NRG’s Power Generation Facilities Operate Without Long-term Power Sale Agreements: The Company’s “merchant” generation fleet operates without long-term power sales agreement, and therefore are exposed to market fluctuations. Without long-term agreements NRG cannot be sure that these facilities will operate profitability in future energy price environments. Exposure to Fluctuation in The Natural Gas Markets: In many of the markets NRG operates in the price of power is typically set by natural gas-fired power plants which have traditionally had higher variable costs than NRG’s coal-fired plants. Decreases in natural gas prices have resulted in a corresponding decrease in the market price of power which significantly reduces the operating margins of the Company’s baseload generation assets. At extremely low natural gas prices, gas plants become more economical than coal generation, in such environments NRG coal-fired units cycle more often or even shut down. 31% of NRG’s generation fleet is coal-fueled. Disruptions of Fuel Supplies: NRG relies upon coal, oil and natural gas to fuel a majority of its generation facilities. Delivery of these fuels depends upon continuing viability of counterparties as well as upon the infrastructure available to serve each facility. There are many risks which can disrupt the distribution of fuel such as, weather conditions, demand levels, changes in market liquidity, etc. For an example of these risks please read this article on well freeze-offs. Competition in the Wholesale Power Markets: Many of the Company’s facilities are old, newer plants owned by the competition are often more efficient than NRG’s aging plants. In order to compete effectively NRG seeks to use its scale and aggregate fuel supplies, efficiently utilize transportation services and transmission services from other Utilities and third-parties. Power Outages: Old facilities require periodic maintenance, and unexpected outages are extremely costly for NRG. Government Regulation: NRG’s business is subject to extensive U.S. federal, state and local laws and foreign laws. Except for ERCOT (Texas), most of NRG’s generation companies are considered ‘public utilities’, which subjects these generation companies to FERC oversight, ratemaking and environmental oversight. There are many ongoing regulatory issues, here are a few examples that the Company is currently dealing with: Cross-State Air Pollution Rule , MATS , CO2 Emissions , and Byproducts, Wastes, Hazardous Materials and Contamination. Interest Rate Risk: NRG’s substantial debt could have negative consequences including: Increasing NRG’s vulnerability to general economic and industry conditions Requiring large portions of NRG’s cash flow from operations to be dedicated to the payment of interest, reducing the Company’s ability to pay dividends Limits NRG’s ability to enter into long-term power agreements Limits NRG’s ability to obtain additional financing for working capital Limiting NRG’s ability to adjust to changing market conditions and placing it at a competitive disadvantage compared to its competitors who have less debt. Expert Opinion: (click to enlarge) * from Yahoo Finance The experts are currently bearish on the prospects of NRG’s near-term stock price. Most experts are providing a “Neutral” or “Hold” rating to NRG. However with NRG’s current price of $25 per share, there is still an upside of 22% to the median price estimate of $30.50. (click to enlarge) * from Yahoo Finance The experts expect NRG to have a difficult year during 2016. EPS is expected to decay from $0.83 for 2015 to $0.17 during 2016. Further the revenues are expected to stagnate between 2015 to 2016 with estimated revenues of $15.33B and $15.31B respectively. Recent News: The California Public Utilities Commission approved the SDG&E Power Purchase and Tolling Agreement for the NRG Energy, Inc Carlsbad Energy Center. The Center is a 500 MW, five unit natural gas peaking plant in southern California. Reliant launches integrated home security, automation solutions. CEO David Crane wins 2015 C.K. Prahalad Award for Global Business Sustainability Leadership. NRG moves to spot 48 on the Fortune 500 List. The Company acquired Goal Zero , a leading provider of portable solar power and battery packs. Through the acquisition NRG hopes to increase cross selling between mass market system power, residential solar and personal power. Conclusion: In conclusion NRG is going through a difficult business pivot. Low Natural Gas prices have hurt NRG’s margins for the electricity generation fleet. However, the low interest rates in the Credit Markets have given NRG financial flexibility to restructure the Company into position which benefits from the major trends in LNG technology adoption, renewable energy, distributed generation and increased energy connectivity of retail customers. NRG is a massive company, so these changes are going to be slow and relatively painful for the company’s bottom line in the near-term. However, if NRG and David Crane can weather this challenging business environment then the Company will be able to apply its scale to capture increasing margins as the Natural Gas Markets bounce back. I recommend NRG as a near-term Short, but a long-term Buy, because the Company’s margins are tied to the fluctuations in the Natural Gas Markets. The Company will refinance at currently attractive interest rates and the global Natural Gas Markets are slowly moving towards parity with one another as the adaptation of LNG technology allows for easier transportation of Natural Gas. These two factors should allow NRG to boost their cash flows from operations and reward long-term investors. Disclosure: I/we have no positions in any stocks mentioned, and no plans to initiate any positions within the next 72 hours. (More…) I wrote this article myself, and it expresses my own opinions. I am not receiving compensation for it (other than from Seeking Alpha). I have no business relationship with any company whose stock is mentioned in this article.
Dividend Growth And Value Investors Should Own ITC As A Core Holding

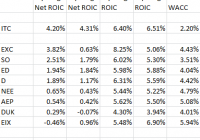
ITC Holdings’ management has earned the highest S&P Quality rating for 10-yr consistence in earnings and dividend growth. No easy feat. Substantially higher Net ROIC, higher allowed ROIC, and a growing regulated asset base are driving earnings and dividend growth higher as well. The current dip is a buying opportunity. The market has not been kind to utility stocks recently, and the current sell-off is offering a few attention-grabbing opportunities. ITC Holdings (NYSE: ITC ) is a company that offers top-ranking management with a record of accomplishment in generating industry-leading investment returns. Add projected annual dividend growth in the 10% to 13% range, along with forward PEG valuations more reminiscent of growth companies than slow growth utilities, and most investors should take notice. S&P Capital IQ offers a rating of 10-yr consistency in earnings and dividend growth known as its Quality Rating and firms are grouped from A+ to D, with B+ being considered average. Of the 500 stocks followed by S&P IQ with a Quality Rating, only 47 carry the A+ rating, and ITC is one of this elite group. ITC has an S&P Credit rating of A- while the industry average is BBB+. Keep in mind the company has been public for only 10 years and would have just qualified for inclusion into the Quality Ratings. One component of management excellence is generating shareholder returns based on total capital deployed that are both higher than its peers and are comfortably above their cost of capital. ITC has generated a 6-yr average return on invested capital ROIC of 6.4% and is higher than the industry average of between 4.5% and 5.0%. More impressive is the low cost of capital at a weighted average cost of capital WACC of just 2.2%, making Net ROIC an impressive 4.2%. While many may see this as small potatoes, investors should compare ITC’s Net ROIC with some bigger, more familiar names, such as those in the spreadsheet below for Exelon (NYSE: EXC ), Southern Company (NYSE: SO ), Consolidated Edison (NYSE: ED ), Dominion Resources (NYSE: D ), NextEra (NYSE: NEE ), American Electric Power (NYSE: AEP ), Duke Energy (NYSE: DUK ), and Edison International (NYSE: EIX ): Source: Guiding Mast Investments, fastgraphs.com, thatswacc.com As shown, ITC management is under-appreciated by most investors for their ability to generate Net ROIC substantially above their peers. One of the keys to ITC’s success is the structural nature of its business focus. ITC is the largest publicly traded electric transmission company with 15,000 miles of FERC-regulated power lines. The subtle difference is the FERC and not individual state utility commissions regulate ITC’s assets, and the FERC has a higher allowed ROE than most states. The chart below from the Edison Electric Institute outlines the progression of lower state allowed ROE since 1990: As shown, the average state-allowed ROE has declined over the past 30 years, and has plateaued at around 10% since 2006. A national energy goal has been the upgrade of the electric grid and the interconnection of new solar and wind generating capacity in areas not historically power generation-oriented. Grid infrastructure investment has been encouraged through offering higher returns on investment dollars, and ITC’s focus has been on those higher return margins. The FERC allows returns in the 10.5% to 11%+ range. To encourage smaller companies, regulated returns offer an additional return incentive of about 1% if the assets are owned by independent firms like ITC. It is estimated that ITC’s long-term allowed ROE will be in the 11.5% range. There is opposition to the higher returns offered by FERC-regulated projects, and last year rates were reduced in the Northeast from as high as 13.4%. With the success of this reduction, consumer advocates are pushing for the formula to apply nationally, and this will negatively affect ITC’s allowed returns with an anticipated allowed ROE reduction from 12.75% to 11.5% by 2016. However, this decline in allowed returns will be offset by a larger network of regulated assets. ITC’s growing asset base and the large quantity of future project opportunities will drive earnings and dividend growth for the next several years. ITC has grown earnings by a three-year average of 12% and raised its dividend by 10%. The consensus is for earnings to continue its 10% to 12% growth rate. The payout ratio is a low 31%, offering management the option to raise dividends faster than earnings growth. Management has targeted mid- to high-30% for a comfortable payout ratio. Last year, the dividend was raised by 14%. ITC is a capital expansion story. Current assets are around $7.1 billion with annual capital expansion budgets of $800 million a year. Operating cash flow will fund a growing portion as ocf increases from $630 million this year to an estimated $770 million in 2018. More information on their cap ex expansion is available in the June 2015 Investor’s Meeting presentation pdf. ITC’s share price has been declining recently due to two factors, general weakness of the utility sector after a lengthy time of outperformance and concerns over the potential for a reduction in allowed ROE. ITC’s share price has followed its peers up and down over the past year until March. At that point, there is a divergence where ITC declined faster than the utility sector. ITC is down about 30% from its high, while the averages are down about 15% and since March, utility stocks have been declined about 5%, while ITC is down 17%. Over the past 12 months, utility stocks are about flat, while ITC is down about 12%. With a 52-wk range of $30.66 and $44.00, the current $32.65 is closer to the low. Another culprit is lower-than-expected first quarter earnings. Analysts were expecting eps of $0.50, but management disappointed by 6% at $0.47. This is a repeat of the previous quarter shortfall of 4%. Management’s guidance for EPS this year is $2.00 to $2.15, with a midpoint of $2.08. Next year’s EPS is estimated at $2.18 to $2.20. Below is the Fastgraph for ITC going back to its IPO in 2005. (click to enlarge) On a forward PEG basis, ITC is trading at a substantial discount to its peers. As described in a previous article , the average forward PEG ratio for the utility sector is 3.2, the average forward P/E is 15.7 and the average EPS growth rate is 4.8%. ITC compares with a forward 2016 PEG of 1.4 based on a 2016 P/E of 15.3 and EPS growth of 11%. While EPS growth is estimated at twice the sector’s growth, ITC’s share prices currently offer no premium valuation. However, in reviewing ITC’s P/E history, it seems it usually trades closer to a P/E of 22 than to 16. If ITC recovers its footing and resumes its premium P/E, it is conceivable share prices could climb to $42 to $48 for patient investors. While the current yield is below the sector average at 2.0%, a high dividend growth rate should overtake the sector average within a few years. The current weakness should be considered a buying opportunity for dividend growth investors and value investors alike. Management has shown its ability to deliver outstanding fundamental returns to shareholders, and the stock warrants a place as a core position in a portfolio. Use this dip to your advantage. Author’s Note: Please review disclosure in Author’s profile. Disclosure: The author is long ITC, AEP, D, EXC, SO. (More…) The author wrote this article themselves, and it expresses their own opinions. The author is not receiving compensation for it (other than from Seeking Alpha). The author has no business relationship with any company whose stock is mentioned in this article.
Cheap Stock With A High Yield Or High Yield With A Cheap Stock? How About Both?

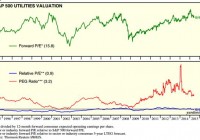
TECO Energy is valued at a substantial discount to its peers based on its forward PEG ratio. TECO Energy offers a current yield of 5.02%. The stigma of its discontinued coal operations along with a dismal dividend growth profile is holding back share prices, but should change with its renewed focus on regulated assets. Are you a value buyer looking for peer undervaluation or are you looking to garner higher income from your invested capital, or a little bit of both? If so, TECO Energy (NYSE: TE ) should be of interest. TE is trading at a comparatively large discount to its anticipated growth rate for the utility sector and the current yield is 5.02%. One measure of fundamental value is the PEG ratio, or price to earnings to earnings growth. Utilities are always on the top of the PEG valuation scale due to slow growth and outsized yields. In most sectors, fair valuation is usually considered at 1.0 for large caps and 1.2 for smaller caps. Over 1.2 is considered overvalued and below 1.0 is undervalued. For utilities, however, it is not uncommon for the PEG ratio to be over 3.0. The PEG ratio for utilities is best used for peer comparisons. One tool that has been used since the early 1970s is the forward PEG ratio, or fundamental valuation based on anticipated 5-yr growth rates and forward earnings estimates. The forward PEG has been one of my personal uppermost due diligence considerations since researching stocks using Value Line in the local library way, way before the internet. The reference librarian got to know me pretty well. However, I digress. Yardeni.com offers an interesting chart of the forward PEG for the utility sector going back 20 years, as represented by the S&P 500 Utility Sector. Below is the chart of the current forward PEG ratio (green line), relative sector P/E to the S&P 500 forward P/E (blue line), and the current forward PEG ratio (red line): (click to enlarge) The current utility sector forward PEG is 3.2 and the average forward P/E is 15.8, reflecting a sector-anticipated growth rate of 4.9%. Enter TECO Energy. The company is going through a transition by selling its coal mining operations to focus solely as a regulated natural gas and electric utility. Its geographic coverage is Tampa Electric (700,000 customers) and Peoples Gas (350,000 customers) in Florida and recently acquired New Mexico Gas (513,000 customers). Earnings per share guidance by management in 2015 is in the $1.08 to $1.10 range, with 2016 consensus estimates of $1.18 to $1.22. Progression in estimates is based on an expansion of its regulated asset base of between 4% and 7%, recent Florida rate case approval with agreed rate increases until 2018, and an allowed ROE in the favorable 10.25% range. TE’s earnings growth rate is offered at between 9.0% and 11.5%, and substantially above the sector average of 4.9%. TECO is trying to sell its coal producing assets in Virginia, Kentucky, and Tennessee. Held as a discontinued asset since third quarter 2014, TECO Coal LLC had a buyer for $80 million in cash and potential future payments of $60 million based on performance targets. However, with the current financial stress of the coal industry, the buyer was unable to acquire the necessary financing and the sale did not close earlier this month. Last week, TE announced a new buyer had stepped in with a 30-day close schedule, but neither terms nor buyers were disclosed. For all intents and purposes, these assets have been written down and the immediate benefit to shareholders from the sale will be a one-time cash inflow of between $0.20 and $0.50 a share. Historically, the coal business has been a large segment of earnings, representing upwards of 30% of net income. As recently as 2011, coal generated over $50 million in income, and coal could be counted on to supply earnings per share of between $0.25 and $0.40 annually. Using the lowest 2016 earnings estimates of $1.13 and the lower project growth rate of 9%, TE’s forward PEG would be 1.7, substantially below the 3.2 of the sector. The current valuation of TE at $17.80 equates to a sector-average forward P/E of 15.7. The undervaluation is based on a much higher growth rate profile. TE’s current yield is 5.02% and represents a substantial income advantage to the sector average 3.5% yield. TE falls in the top tier of utility dividend payers for yield, but offers the disadvantages of a high payout ratio and very low historic dividend growth. While earnings growth is expected to be above average, until the payout ratio declines from around 87% last year to a more comfortable 65% to 70%, investors should not expect dividend growth above a mere nominal level. For example, 3-yr TE dividend growth is 1.3% and 5-yr dividend growth is 1.9%. The best investors should expect over the next three years is inflation-matching dividend growth. However, the current yield of 5.02% should pique the interest of income seekers. Historically, natural gas utilities offer some of the lowest yields in the sector. Using Hennessey Natural Gas Utility Fund (MUTF: GASFX ) and a few of the more popular gas utility stocks as proxies, the representative yield could be between 2.1% and 3.3%. With 50% of customer count from its gas utilities, TE’s yield is comfortably above these averages. Management has generated returns on invested capital in excess of sector average. With peer-average in the 4.5% to 5.0% range, TE’s 5-yr average ROIC is 6.0%, and 3-yr average ROIC is 5.5%. However, their cost of capital is high at 5.7%, according to ThatsWACC.com. TECO could be either an acquirer of smaller utilities, such as its purchase of New Mexico Gas, or as a candidate in the continuing march of utility consolidation. Until the stigma of coal is washed from investors’ memory, TE will trade based on its yield and not its growth prospects. If management delivers on its regulated growth platform, today’s share price and corresponding yield could be looked at as being both cheap and high yield. Author’s Note: Please review disclosure in Author’s profile. Disclosure: The author has no positions in any stocks mentioned, but may initiate a long position in TE over the next 72 hours. (More…) The author wrote this article themselves, and it expresses their own opinions. The author is not receiving compensation for it (other than from Seeking Alpha). The author has no business relationship with any company whose stock is mentioned in this article.