Scalper1 News
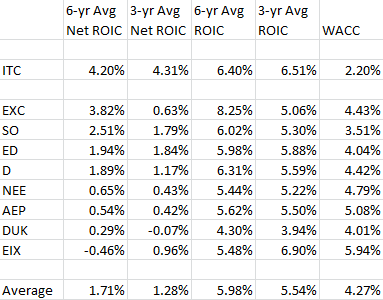
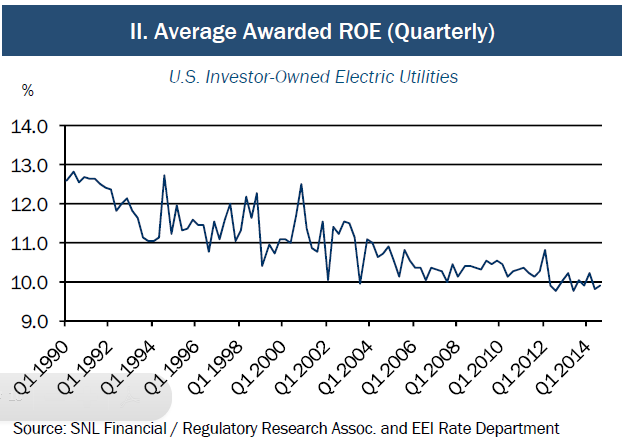
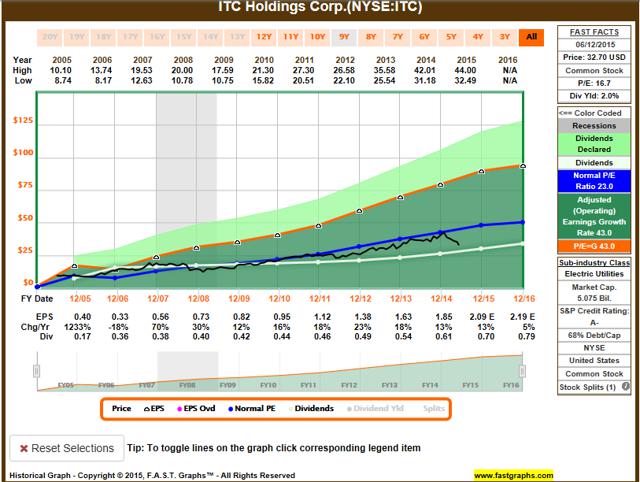 ITC Holdings’ management has earned the highest S&P Quality rating for 10-yr consistence in earnings and dividend growth. No easy feat. Substantially higher Net ROIC, higher allowed ROIC, and a growing regulated asset base are driving earnings and dividend growth higher as well. The current dip is a buying opportunity. The market has not been kind to utility stocks recently, and the current sell-off is offering a few attention-grabbing opportunities. ITC Holdings (NYSE: ITC ) is a company that offers top-ranking management with a record of accomplishment in generating industry-leading investment returns. Add projected annual dividend growth in the 10% to 13% range, along with forward PEG valuations more reminiscent of growth companies than slow growth utilities, and most investors should take notice. S&P Capital IQ offers a rating of 10-yr consistency in earnings and dividend growth known as its Quality Rating and firms are grouped from A+ to D, with B+ being considered average. Of the 500 stocks followed by S&P IQ with a Quality Rating, only 47 carry the A+ rating, and ITC is one of this elite group. ITC has an S&P Credit rating of A- while the industry average is BBB+. Keep in mind the company has been public for only 10 years and would have just qualified for inclusion into the Quality Ratings. One component of management excellence is generating shareholder returns based on total capital deployed that are both higher than its peers and are comfortably above their cost of capital. ITC has generated a 6-yr average return on invested capital ROIC of 6.4% and is higher than the industry average of between 4.5% and 5.0%. More impressive is the low cost of capital at a weighted average cost of capital WACC of just 2.2%, making Net ROIC an impressive 4.2%. While many may see this as small potatoes, investors should compare ITC’s Net ROIC with some bigger, more familiar names, such as those in the spreadsheet below for Exelon (NYSE: EXC ), Southern Company (NYSE: SO ), Consolidated Edison (NYSE: ED ), Dominion Resources (NYSE: D ), NextEra (NYSE: NEE ), American Electric Power (NYSE: AEP ), Duke Energy (NYSE: DUK ), and Edison International (NYSE: EIX ): Source: Guiding Mast Investments, fastgraphs.com, thatswacc.com As shown, ITC management is under-appreciated by most investors for their ability to generate Net ROIC substantially above their peers. One of the keys to ITC’s success is the structural nature of its business focus. ITC is the largest publicly traded electric transmission company with 15,000 miles of FERC-regulated power lines. The subtle difference is the FERC and not individual state utility commissions regulate ITC’s assets, and the FERC has a higher allowed ROE than most states. The chart below from the Edison Electric Institute outlines the progression of lower state allowed ROE since 1990: As shown, the average state-allowed ROE has declined over the past 30 years, and has plateaued at around 10% since 2006. A national energy goal has been the upgrade of the electric grid and the interconnection of new solar and wind generating capacity in areas not historically power generation-oriented. Grid infrastructure investment has been encouraged through offering higher returns on investment dollars, and ITC’s focus has been on those higher return margins. The FERC allows returns in the 10.5% to 11%+ range. To encourage smaller companies, regulated returns offer an additional return incentive of about 1% if the assets are owned by independent firms like ITC. It is estimated that ITC’s long-term allowed ROE will be in the 11.5% range. There is opposition to the higher returns offered by FERC-regulated projects, and last year rates were reduced in the Northeast from as high as 13.4%. With the success of this reduction, consumer advocates are pushing for the formula to apply nationally, and this will negatively affect ITC’s allowed returns with an anticipated allowed ROE reduction from 12.75% to 11.5% by 2016. However, this decline in allowed returns will be offset by a larger network of regulated assets. ITC’s growing asset base and the large quantity of future project opportunities will drive earnings and dividend growth for the next several years. ITC has grown earnings by a three-year average of 12% and raised its dividend by 10%. The consensus is for earnings to continue its 10% to 12% growth rate. The payout ratio is a low 31%, offering management the option to raise dividends faster than earnings growth. Management has targeted mid- to high-30% for a comfortable payout ratio. Last year, the dividend was raised by 14%. ITC is a capital expansion story. Current assets are around $7.1 billion with annual capital expansion budgets of $800 million a year. Operating cash flow will fund a growing portion as ocf increases from $630 million this year to an estimated $770 million in 2018. More information on their cap ex expansion is available in the June 2015 Investor’s Meeting presentation pdf. ITC’s share price has been declining recently due to two factors, general weakness of the utility sector after a lengthy time of outperformance and concerns over the potential for a reduction in allowed ROE. ITC’s share price has followed its peers up and down over the past year until March. At that point, there is a divergence where ITC declined faster than the utility sector. ITC is down about 30% from its high, while the averages are down about 15% and since March, utility stocks have been declined about 5%, while ITC is down 17%. Over the past 12 months, utility stocks are about flat, while ITC is down about 12%. With a 52-wk range of $30.66 and $44.00, the current $32.65 is closer to the low. Another culprit is lower-than-expected first quarter earnings. Analysts were expecting eps of $0.50, but management disappointed by 6% at $0.47. This is a repeat of the previous quarter shortfall of 4%. Management’s guidance for EPS this year is $2.00 to $2.15, with a midpoint of $2.08. Next year’s EPS is estimated at $2.18 to $2.20. Below is the Fastgraph for ITC going back to its IPO in 2005. (click to enlarge) On a forward PEG basis, ITC is trading at a substantial discount to its peers. As described in a previous article , the average forward PEG ratio for the utility sector is 3.2, the average forward P/E is 15.7 and the average EPS growth rate is 4.8%. ITC compares with a forward 2016 PEG of 1.4 based on a 2016 P/E of 15.3 and EPS growth of 11%. While EPS growth is estimated at twice the sector’s growth, ITC’s share prices currently offer no premium valuation. However, in reviewing ITC’s P/E history, it seems it usually trades closer to a P/E of 22 than to 16. If ITC recovers its footing and resumes its premium P/E, it is conceivable share prices could climb to $42 to $48 for patient investors. While the current yield is below the sector average at 2.0%, a high dividend growth rate should overtake the sector average within a few years. The current weakness should be considered a buying opportunity for dividend growth investors and value investors alike. Management has shown its ability to deliver outstanding fundamental returns to shareholders, and the stock warrants a place as a core position in a portfolio. Use this dip to your advantage. Author’s Note: Please review disclosure in Author’s profile. Disclosure: The author is long ITC, AEP, D, EXC, SO. (More…) The author wrote this article themselves, and it expresses their own opinions. The author is not receiving compensation for it (other than from Seeking Alpha). The author has no business relationship with any company whose stock is mentioned in this article. Scalper1 News
Scalper1 News