Tag Archives: economy

On The Winners And Losers Of The Great Chinese Rebalance
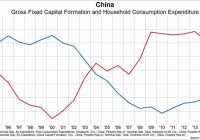
China’s economy is in the midst of a transition from an investment led growth model to a consumption led growth model. This week has seen what we believe to be an acceleration of this transition with the slight altering of China’s currency peg to the US dollar. China’s investment share of GDP must fall from 48% to 35% while consumption rises from 38% to closer to 50%, and it could take a decade. There will be winners and losers on both sides with consumer oriented plays benefiting while commodity oriented plays get pinched. Change can be hard, but change can also be good. At this very moment we are living through one of the largest and potentially destabilize periods of economic change in the last century. It is the mirror image and reversal of the last great economic paradigm shift. It is China’s shift from an investment driven growth model to a consumption driven growth model. For some it is painful. For others who are correctly positioned it is extremely lucrative. It is affecting all of us whether we know it or not. But most of all, it is inevitable. This week has seen what we believe to be an acceleration of this change. China continued to make baby steps towards liberalizing its financial system by altering – slightly – the defacto peg to the US dollar. China is notorious for “feeling the stones as [they] cross the river”, and this latest currency regime shift is just one stone of many that will eventually lead to a much more open and consumption driven economy, but it will take years. To be clear, when we say that China is shifting from an investment led economic growth model to a consumption led model, we are referring to a literal flip flop in the share of investment and consumption as a percent of GDP. As the first chart below shows, from 2000-2013, investment as a percent of China’s GDP grew from 35% to 48%. Meanwhile, consumption as a percent of GDP fell from 47% to a low of 36%. There is no correct ratio of investment as a percent of GDP, but many emerging market countries run at about 35%. This is because sustaining an abnormally high investment share of GDP – say around 48% as China has done – for a long period of time requires a massive buildup of debt which has practical limits. China is undergoing this uncomfortable shift in its economy and it will likely take a decade to get there. In the meantime, there are plenty of consequences, both good and bad, for stakeholders. (click to enlarge) From an arithmetic perspective, transitioning from 48% investment to 35% investment and from 36% consumption to 47% consumption requires three things. First, growth in investment (think infrastructure/property development) must slow dramatically from a 20% plus pace to a low single digit pace and then stay at that low single digit growth rate for some time. Second, growth in consumption expenditure must rise from the current rate of about 10% to somewhere closer to 20% and then continue to grow at 20% for some time. Third, the overall growth rate of the economy must fall from the current 7% rate to something closer to 3-4%, if not lower. In extremely simple terms, the growth rate of rail lines, apartment buildings, the occasional empty city, and everything required to make those things must fall dramatically while the growth rate of things like spending on consumer goods and health care must rise dramatically. As the next chart below demonstrates, China has made a good amount of progress on the investment side (but mind you many, many more years of even lower investment growth are ahead of us), but consumption has yet to see its required growth spurt. (click to enlarge) One of the most obvious consequences of the requisite slowdown in the rate of investment growth is the practically assured collapse in commodity prices, as we have seen. Indeed, the price of oil, copper, and raw materials more generally have been highly correlated to China’s investment share of GDP, as the next three charts below demonstrate. As China’s transition continues to play out over the next number of years, the probability of continued weakness in commodities will remain elevated. Remember, this is a potentially decade-long process that has according to our interpretation of the data just begun. (click to enlarge) (click to enlarge) (click to enlarge) On the flip side of the equation, we should also be seeing healthy growth rates in companies catering the Chinese consumer, and we are. In the two tables below we categorize all non-financial non-utility companies in the China Securities Index 300 (CSI 300) into either consumer related companies (first table) or industrial related companies (second table). We then show the aggregate annual growth rates in sales and liabilities for both of these groups. The data clearly shows stability in the top line growth rate of the consumer related companies and cratering growth among the industrial/investment related companies. Given the required duration of this transition, we think there is a high probability that we see these trends continue and even permeate more broadly into other equity markets in both the emerging and developed worlds. (click to enlarge) Source: Gavekal Capital (click to enlarge) Source: Gavekal Capital So the big question is obviously what all this means from an investment perspective. To our mind the clear takeaway is that investors should be overweight EM and DM consumer, heath care, technology, and high tech manufacturing companies with exposure to China and other emerging markets making a similar transition. These companies stand to benefit from the heightened consumption growth and the “move up the value chain” goal of many emerging market countries in terms of manufacturing. Alternatively, investors would be well suited to underweight the areas of the EM and DM stock markets with direct or indirect exposure to China including energy, materials, utilities and industrial manufacturing with a low gross profit margin (basically commodity and commodity pass through plays). The practical problem of course is that market capitalization weighted and even most smart beta ETFs that invest in EM stocks (think VWO , EEM , or DEM ) typically have high weightings to the exact areas that are most likely to see slowing growth. The same can be said for developed market ETFs such as VT , ACWI , ACWV , SDIV and URTH . The trick is to find vehicles that offer the opportunity to benefit from China’s years-long transition instead of vehicles that are in effect leaning against it. The original posting of this article can be found here . Disclosure: I/we have no positions in any stocks mentioned, and no plans to initiate any positions within the next 72 hours. (More…) I wrote this article myself, and it expresses my own opinions. I am not receiving compensation for it. I have no business relationship with any company whose stock is mentioned in this article.
3 Funds For Liquid Assets

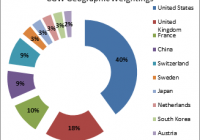
Global water resources are poorly managed, if at all and population growth is creating stresses on existing water resources. Advanced and newly emerged market economies are addressing the problem via private sector investment. Guggenheim, Invesco and First Trust offer funds specializing in the water management industry. In the famous opening scene of ‘Lawrence of Arabia’, Lieutenant Lawrence (Peter O’Toole) is shocked to see a man shot dead simply for drawing water from a well without having permission. Lawrence, a naive newcomer to the unforgiving desert argues with the Sheik (Omar Sharif) who shot the man. The Sheik ends the argument: ” He was nothing. The well is everything… he knew that, ” he said angrily. Although this may be taken as mere Hollywood drama, wars have been actually been fought over water. ‘Water Conflicts’ have occurred in the desert regions of North East Africa, Central Asia and the Middle East. The United Nations Department of Economic and Social Development declared 2005 – 2015 an International Decade for Action, designated “Water for Life” . According to the UN: … Around 1.2 billion people, or almost one-fifth of the world’s population, live in areas of physical scarcity, and 500 million people are approaching this situation. Another 1.6 billion people, or almost one quarter of the world’s population, face economic water shortage… …Water use has been growing at more than twice the rate of population increase in the last century… …There is enough freshwater on the planet for seven billion people but it is distributed unevenly and too much of it is wasted, polluted and unsustainably managed . In fact: Around 700 million people in 43 countries suffer today from water scarcity. By 2025, 1.8 billion people will be living in countries or regions with absolute water scarcity, and two-thirds of the world’s population could be living under water stressed conditions. With the existing climate change scenario, almost half the world’s population will be living in areas of high water stress by 2030, including between 75 million and 250 million people in Africa. In addition, water scarcity in some arid and semi-arid places will displace between 24 million and 700 million people. Thanks to the deep ‘reservoir’ of Exchange Traded Funds managed and organized by the world’s largest investment firms, there is likely to be ‘a capital’ solution to the problem, and thus presents a patient investor with a conduit to profit from a water management industry buildout. There are three listed funds to be found in Seeking Alpha ETF pool. All three came to the market in 2007. In order of 1 year performance are the Guggenheim S&P Global Water Index ETF (NYSEARCA: CGW ) , the Invesco PowerShares Global Water Portfolio (NYSEARCA: PIO ) and the First Trust ISE Water Index Fund (NYSEARCA: FIW ) . The main features are described below: Fund Manager and Symbol Tracking Index Investment Strategy Year to Date 1 Year 3 Years Fees and Expenses Recent Price Distribution Yields Guggenheim: CGW S&P Global Water Index Passive 1.85% -3.46% 13.71% 0.65% $28.34 1.77% Invesco: PIO NASDAQ OMX Global Water Index Active 3.66% -1.39% 15.31% 0.76% $23.07 1.27% First Trust: FIW ISE Market Cap weighted Index Passive -6.62% -8.88% 11.91% 0.59% $29.94 0.71% ( Data from Guggenheim, Invesco and First Trust Websites) Two of the three funds, Guggenheim’s CGW and Invesco’s PIO are globally diversified, whereas, of the First Trust Fund’s 36 holdings, 33 are U.S. based, with one Brazilian, one U.K. and one Grand Cayman Island based company. As far as the two globally diversified funds, CGW and PIO, the two charts demonstrate that the top sector weightings are nearly identical. ( Data from Guggenheim and Invesco ) Needless to say, there are only a limited number of holdings which fit the category. Guggenheim’s CGW has over 50 holdings, Invesco’s PIO has 35 holdings and First Trust’s FIW has 35 holdings. It’s reasonable to conclude that there’s some overlap between funds. Indeed, on closer inspection, only seven of the First Trust Fund’s holdings may be found in either the Guggenheim or Invesco funds. On the other hand 24 of the 35 Invesco fund holdings are also holdings of the Guggenheim fund; that is to say almost half of the Guggenheim fund’s holdings are also holdings in the Invesco fund. This is in spite of the fact that each fund tracks a different index in this asset subclass. Further, as demonstrated in the geographical weightings charts, the top seven heaviest weighted regions of both Guggenheim’s CGW and Invesco’s PIO are identical. On the other hand, First Trust’s FIW is virtually a U.S. centric water industry fund and the most unique of the three. ( Data From Guggebheim, Invesco and First Trust) All three funds have similar performance over the past three years. Hence, what should an investor consider to be the deciding factor as to which fund to invest in? A strange as it may sound, it might be best to ignore the usual metrics and to investigate where the worst water shortages exits, where the worst water pollution exit and which governments will be quick to respond. One notable example which has made headlines recently has been concerns about the water pollution in Brazil, particularly in Rio de Janeiro, host city to the 2016 summer Olympic Games. It just so happens that Companhia de Saneamento Basico do Estado de Sao Paulo ( OTC:CSBJF ) accounts for 1.365% of the Invesco fund and 1.01% of the Guggenheim fund. Just briefly: The Company is engaged in the provision of basic and environmental sanitation services in the State of Sao Paulo, as well as it supplies treated water and sewage services on a wholesale basis. The Company operates two segments: water supply and sewage services. It operates water and sewage services in approximately 364 municipalities of the State of Sao Paulo . -(Reuters) Although Rio is several hundred miles to the north in the neighboring state, having the eyes of the world suddenly focused on the polluted waters of Rio, it would be reasonable to expect the Brazilian government to budget funds towards water cleanup before the Olympic games begin. A second example may be found in China’s remarkable economic miracle, lifting millions out of poverty and driving economic growth the world over. However, it was not without environmental costs. Air and water quality issues have been largely ignored as the economy develop. Both Guggenheim and Invesco allocate 9% towards China. Below is a table of companies common to both. Company Name (Symbol/Exchange) Business Weighting Beijing Enterprises Water Group ( OTC:BJWTY ) Water Reclamation, Desalination, Sewage Treatment, Consultancy Services; global as well as domestic projects. CGW: 2.04% PIO: 4.01% China Everbright Water ( OTCPK:BOTRF ) Water Reclamation, Industrial Waste Water Treatment, Sludge Treatment CGW: 2.52% PIO: 0.595% China Water Industry Group (1129.HK/Hong Kong) Water Supply, Sewage Treatment, Water Infrastructure Construction; at least 7 water/sewage related subsidiaries CGW: 0.14% PIO: 0.449% (Overlap of CGW and PIO China Exposure) Not every holding is a ‘pure-play’ water resource management company. For example, Guggenheim’s CGW has a 2.4% position in Guangdong Investment ( OTCPK:GGDVY ), a property developer with a subsidiary holding in water resource management. Also, Invesco’s PIO has a position in China Longyuan Power Group Corp Ltd ( OTCPK:CLPXY ), an electric power generating company focusing on wind and coal power, and a position in First Solar (NASDAQ: FSLR ) the well-known photovoltaic panel manufacturer. Neither company seems to be directly related to the water industry, however, First Solar does offer liquid separation recycling solutions and Longyuan Power generates electricity from ‘tidal power’. Lastly are those water concerns here in the United States, most notably California. It’s been well publicized that California reservoirs are critically low and that wells are drilling into deep aquifers which took tens of thousands of years to form and will take hundreds of years to replenish. First Trust’s FIW fund does have positions in California Water Utilities through California Water Services Group (NYSE: CWT ) and its subsidiaries: The Company through its wholly owned subsidiaries provides water utility and other related services in California, Washington, New Mexico and Hawaii… …The Company’s business consists of the production, purchase, storage, treatment, testing, distribution and sale of water for domestic, industrial, public and irrigation uses, and for fire protection. It also provides non-regulated water- related services under agreements with municipalities and other private companies. The non-regulated services include full water system operation, billing and meter reading services. – (Reuters) Another California Water Utility Service Company is American States Water (NYSE: AWR ), the parent company of Golden State Water Company whose business is in: The purchase, production and distribution of water in 75 communities in 10 counties in the State of California… …GSWC’s water utility operations have a diversified customer base, residential and commercial customers account for the GSWC’s water sales and revenues. -(Reuters) Also, American States Utilities , another wholly owned subsidiary of AWR is contracted by the U.S. government to supply water services to military installations. To sum up, those fortunate enough to be living in advanced economy nations have plentiful access to high quality potable water. However, poor management, growing population which demands water as well as agricultural products will certainly bring about changes in the way water is purposed and distributed. So the investor has choices in this very specialized area. The First Trust Fund focuses on the domestic U.S. water industry. No doubt between California and the U.S. Federal Government funds can be made available, should the situation worse. However, the drought problem in the United States may resolve itself should normal rain and snow falls resume. On the other hand, heavily polluted waterways, critical to the health and well-being of the general populations in Brazil and China will not simply resolve themselves and will require spending and many years of new infrastructure construction. Hence the Guggenheim CGW and Invesco PIO fund are better positioned for global solutions. The main risk in those two funds is whether the governing bodies of newly emerged nations consider environmental issues a top priority. Hence all three funds have the potential to provide good returns, and likewise all three incur risks. The ultimate risk, however, will be the accrued cost of ignoring the haphazard way water resources are managed the world over. Disclosure: I/we have no positions in any stocks mentioned, and no plans to initiate any positions within the next 72 hours. (More…) I wrote this article myself, and it expresses my own opinions. I am not receiving compensation for it (other than from Seeking Alpha). I have no business relationship with any company whose stock is mentioned in this article. Additional disclosure: CFDs, spread betting and FX can result in losses exceeding your initial deposit. They are not suitable for everyone, so please ensure you understand the risks. Seek independent financial advice if necessary. Nothing in this article should be considered a personal recommendation. It does not account for your personal circumstances or appetite for risk.

Is More Information Making Us Worse Investors?

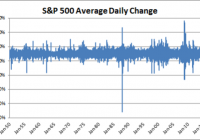
Study after study has shown that retail investors and professional money managers just aren’t very good at investing. And the primary cause of this poor performance is being overly active and incurring lots of unnecessary taxes and fees. The pros can’t control themselves because they have to impress their clients by trying to look active and “beat the market.” And the retail investor is prone to be short term because they know their financial lives are a series of short-term financial events in a long-term life. But an interesting thing appears to be occurring over the course of the last 65 years. Despite a preponderance of information and market access, we seem to be getting no better at investing AND the markets seem to be getting more volatile. If we look at the average daily change in the S&P 500, we can see a slight shift in the variance of the data over time: That’s not very clear, though. If we rearrange that chart, we can construct the average annualized standard deviation of the daily returns: This chart clearly shows that stock market volatility has increased over the last 65 years. There is almost certainly a multitude of causes here, but I don’t think it’s a coincidence that the 1980s and the era of new technology and market access has coincided with the explosion in higher volatility since then. This makes me wonder about two things: What does this say about information theory, economic theory and financial theory? What does this tell us about the current era of investing? What does this say about information theory, economic theory and financial theory? One would think that more information would make the markets behave more “efficiently.” And while we know that professional investors don’t beat the market consistently, we also know that the average holding time on stocks has cratered over the last 70 years, which means that investors, in the aggregate, are paying more in taxes and fees than they previously did. In fact, the average holding period is now consistent with a short-term capital gains rate which means the business of active investing has become a lucrative business for Uncle Sam! This means, by definition, that the post-fee and post-tax return on the aggregate of publicly-held stocks has to be lower than it was in 1940. This would seem to imply that easier access to markets and information has actually made us worse at investing. More information isn’t making us more rational or more efficient. It’s fueling our behavioral biases and short-term tendencies. Access to trading accounts combined with the 24-hour news cycle has become a behavioral nightmare for investors. And yet the vast majority of investors think that all of this information is making them smarter when the data shows that they’re not nearly as financially competent as they think. Contributing to this is all the new technologies. This includes discount brokerage firms, high-frequency trading, leveraged index funds, robo advisors, free trading applications, etc. All of these businesses feed off of our “get rich quick” mentality and/or give us access to markets in an unprecedented manner which fuels our behavioral biases in any number of ways. Further, investors haven’t been compensated for this added volatility. The average 3-year return on the S&P 500 is only marginally higher in the last 25 years than it is over the last 65 years. This shows how futile the idea of “risk” as “standard deviation” really is. In other words, the textbook model of the financial markets hasn’t at all reflected what one might have expected where more information makes markets more efficient, and more volatility compensates investors for what is considered more risk. Basically, modern financial theory doesn’t tell us much about modern financial reality. What Does This Tell us About the Modern Era of Investing? Nothing good. I’ve talked about the difficulty of managing time in one’s portfolio . This intertemporal conundrum is, by a wide margin, the most difficult concept to master in portfolio management. This is the problem of time in an investor’s portfolio. While we know we should be long term, we are inclined to be short term for any number of reasons. Threading that needle and finding the timeframe that makes the most sense for you is incredibly difficult. I’d venture to guess that investors in the 40s probably weren’t far off with their 7-year period. Sadly, what I seem to be finding is that more and more investors are veering in the direction of being ultra short term, hoping to make the quick risk-free buck. And in doing so, they’re falling victim to all of the behavioral biases that are driving this extremely short-term view which necessarily leads to poor performance.