Tag Archives: economy

USO: A New Way To Think About Your Oil Investments

The surprising plummet in petroleum prices over the past 12 months has caught a lot of people off-guard, and has presented a variety of consequence. For investors, It has created downward pressure on most, but not all petroleum-related equities. For many Americans with less of a vested interest in the matter, the drop has meant a quasi-tax-cut, with a gallon of gas falling from $4-$5 a gallon to something a bit more tolerable. Those employed by the industry may be fearing for their position or may have already been told they are out of work. Foreign economies dependent on oil exporting are vulnerable to economic collapse. The integrated oil giants such as Chevron (NYSE: CVX ), Exxon (NYSE: XOM ), and BP (NYSE: BP ) tend to be core holdings in many long-term portfolios. While perpetual optimists – sometimes referred to as “perma-bulls,” seem steadfast in the view that oil prices will “come back,” I would caution against that assumption. “Forever” investors – those that buy and generally never sell a stock – have no choice but to think in optimistic terms since they, either voluntarily or involuntarily, lock themselves into ownership. The fact of the matter is we don’t know that oil will “come back.” We may never see $100 a barrel oil again in our lifetimes. Near-term we are swimming in a veritable glut of the stuff. Supply imbalance combined with bullish speculator abandonment of petroleum, has created, as is typically in today’s fluid financial markets, a frenzy of attention. OPEC has not helped those looking for a price reprieve and seems keen on keeping production level, and prices low. The price of the United States Oil Fund LP ETF (NYSEARCA: USO ) has fallen 28 percent in six months. Whether you think the price action is justified or not should not be a huge consideration, although a forward thesis can help you keep focus on how your approach energy investment. As an investor you must learn to cope with varying situations. To assume you know what the price of oil will do in the coming months, years, or decades, is foolhardy. Uncertainty of financial markets is why diversification, amongst asset type, sectors, stocks, and investment style is such a strong risk management tool. For some investors, adding to these kinds of stocks may make sense here, for others, taking their lumps and decreasing net exposure to oil may be the proper move. Opportunistic investors should avoid obsession over the decline in oil stocks , instead focusing in on industries that might benefit from prolonged cheap oil. Instead of adding to a position in Exxon, which is being pressured, how about investing in airlines – an industry where fuel is a significant expense. How about cruise lines – again, an industry that sees fuel as a significant input and where tame pricing leads direct to the bottom line. Automakers stand to benefit the longer oil prices stay low . With more disposable income in their pocket, consumers may opt for bigger gas guzzlers that means higher margins for auto companies. How about trucking companies? Get out of the box and start thinking where profits may be soaring. While Exxon has dropped 25% the past year, Southwest Airlines (NYSE: LUV ) has risen 25 percent. That disparity could continue. Don’t short USO, when there’s safer plays that could be just as rewarding out there against an oil collapse. There are certainly other areas in the market where waiting around for something to happen has not been the wisest of bets. For years there have been those thinking that the bond market has been in a bubble. Most of these investors have sat on the sidelines, most likely in cash, waiting for a massive rise in interest rates that has yet to materialize. It may never materialize . As I write this, the 10-Year Treasury sits at 2.15% after briefly brushing up against 2.5 percent. While even I have cautioned against getting too slap happy with long-term bonds – those with bond exposure have earned their coupons without issue, while those who’ve sat in cash have suffered tremendous opportunity cost. Even if the Fed moves to tighten this year, which is starting to seem rather likely, it’s possible that long rates continue their dovish pattern. Who benefits from low rates? Highly levered companies with solid business models that can obtain low cost capital. Again, instead of focusing on when rates will rise, take advantage of what is, and has been, on the table for quite some time now. Might that end tomorrow,? Perhaps. But don’t invest like you absolutely know how things will shake out. Hedge yourself and manage risk. Indeed, leveraging an entire portfolio to one idea can pose disastrous risk. The investor less exposed to energy over the past year or leveraged to ideas premised on falling oil prices (airlines, cruise lines) has made out like a bandit. Your great-grandfather who has pledged absolutely allegiance to oil stocks, not so much. Instead of guessing when things might happen or sitting on an industry or idea that has obvious headwinds, learn to embrace what the economy and financial markets afford you. It’s one thing to be optimistic. It’s another thing to pretend you know more than you really do. Disclaimer: The above should not be considered or construed as individualized or specific investment advice. Do your own research and consult a professional, if necessary, before making investment decisions. Adam Aloisi was long shares of Southwest Airlines, Norwegian Cruise Line, Exxon, and General Motors at time of writing, but positions can change at any time. Link to the original post here
4 Country ETFs To Gain From Weak Commodity Prices

Commodities across the board, ranging from natural resources to metals, are trapped in a vicious trading circle this year and see no sign of respite. This is especially true, as the Bloomberg Commodity Index has plunged nearly 13% in the year-to-date time frame. This is especially true in the backdrop of a strong dollar, global growth concerns, global supply glut and waning demand that have dampened the appeal for the commodities. Notably, a rising U.S. currency makes dollar-denominated assets more expensive for foreign investors. In particular, a persistent slowdown in the world’s largest buyer of raw materials – China – and the turmoil in the Chinese stocks have been the major culprits. To add to the woes, the latest disappointing trade data and China’s surprise move to devalue its currency, the yuan, has raised concerns over the health of the world’s second-largest economy. This suggests that demand for basic industrial commodity inputs will remain weak. Sluggish growth in the Eurozone and a possible U.S. interest rates hike are also taking a toll on the commodities market with an extreme bearish outlook on a number of commodities like natural gas, oil, coffee, sugar, wheat, corn, platinum, nickel, gold, aluminum, silver and copper. While low commodity prices are threatening a number of commodity producers and key producing countries, they are a boon to the raw material intensive nations. This is because persistent weakness in commodities has made raw materials extremely cheap for the countries that import them. It will lead to expansion in balance of payments, increase output and reduce inflation in these countries, thereby leading to a surge in overall economic growth. As a result, commodities importing countries are expected to outperform as long as the commodities slump. In fact, some nations have seen this phenomenon take place while many are yet to see the positive impact of lower prices due to their slumping currencies. With the advent of ETFs, these nations are easier to play than ever. In light of this, we have highlighted four country ETFs that could enjoy smooth trading in the months ahead should commodity prices remain weak or fall further. Investors should note that these funds have a favorable Zacks ETF Rank of 2 (Buy) or 3 (Hold). iShares MSCI India ETF (BATS: INDA ) Falling commodity prices would benefit India, which is a net commodity importer, and provide a boost to national income. While crude oil accounts for one-third of the total imports, industrial metals, coal and precious metals also make up for a large part of imports. Given this, Indian ETFs could see smooth trading in the coming months and INDA could be one of the intriguing picks to play the surge. It follows the MSCI India Total Return Index and charges 68 bps in fees per year from investors. Holding 71 stocks in its basket, the fund is highly concentrated on the top two firms – Infosys (NYSE: INFY ) and Housing Development Finance Corp. (NYSE: HDB ) – that together make up for 20% of total assets. Other firms hold no more than 6.29% share. Further, the product is slightly tilted towards the information technology sector at 21.5% while financials, consumer staples, healthcare and energy round off the top five. The ETF has amassed over $3.9 billion and trades in volume of nearly 2 million shares a day. INDA is up 2.5% in the year-to-date time frame and has a Zacks ETF Rank of 2. iShares MSCI Italy Capped ETF (NYSEARCA: EWI ) Italy imports about 17% of oil, and 10% of minerals and non-ferrous metals. In addition, it also imports food products and beverages from its trading partners. The best way to invest in Italy is through EWI, a product that has nearly $1.1 billion in assets. The fund tracks the MSCI Italy 25-50 index, holding 26 stocks in its basket. It is heavily concentrated on the top two firms, Intesa Sanpaolo ( OTCPK:ISNPY ) and Eni (NYSE: E ), with a combined 23% share while other securities hold less than 8% of total assets. Further, about 42% of the fund’s portfolio is allotted to financials from a sector look while utilities, energy, industrials and consumer discretionary round off the top five with double-digit exposure each. The fund trades in heavy volume of more than 2.2 million shares a day on average and charges 48 bps in annual fees. It has returned about 17.1% so far this year and has a Zacks ETF Rank of 2. iShares MSCI Netherlands ETF (NYSEARCA: EWN ) The Netherlands is also a big net importer of oil, which accounts for 29% of total imports. Iron, steel and aluminum also make up for nearly 5% of imports. The most popular way to target the Dutch economy is with EWN, which tracks the MSCI Netherlands Investable Market Index. In total, the fund holds 50 stocks in its basket with the largest allocation to the top two firms – Unilever (NYSE: UN ) and ING Groep (NYSE: ING ) – that together make up for 33.7% of assets. Other firms hold no more than 8.55% share. Consumer staples and financials actually take the top two spots in the basket with 30% and 22.7% share, respectively, while industrial and information technology also account for double-digit exposure each. The product is rich as it has accumulated over $208.7 million in AUM and sees average daily volume of nearly 2.3 million shares. Expense ratio came in at 0.48%. The fund has gained 10.7% so far this year and has a Zacks ETF Rank of 2. iShares MSCI South Korea Capped ETF (NYSEARCA: EWY ) Last but not the least, South Korea is the major beneficiary of lower commodity prices, which in turn would boost investments and consumption. While oil forms a hefty 23% of total imports, natural gas, coal, steel and iron ore also account for a decent part of imports. Investors could focus on this economy (Asia’s fourth largest) through the proxy $3.6-billion EWY, which is the most popular and liquid option to track the country’s equity space. The ETF follows the MSCI Korea 25/50 index, holding 109 stocks in its basket. Samsung ( OTC:SSNLF ) dominates the fund’s return at nearly 20% while other firms hold less than 3.7% of assets. From a sector look, information technology accounts for nearly one-third share while consumer discretionary, financials and industrials round off the next three spots with double-digit allocation each. The fund trades in average daily volume of 2.5 million shares and charges 62 bps in annual fees. It has lost 13.3% in the year-to-date time frame, as a decline in the South Korean currency more than offset the lower commodity prices. EWY has a Zacks ETF Rank of 3. Original Post

VDADX: A Great Mutual Fund That Is Remarkably Low On 2 Key Sectors

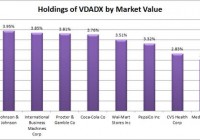
Summary VDADX offers investors a great start to building a dividend portfolio. The fund is missing almost all exposure to the utility sector and to oil and gas. The expense ratio is exceptionally low, and the historical volatility has been better than that of the market. Investors should be seeking to improve their risk-adjusted returns. I’m a big fan of using ETFs to achieve the risk-adjusted returns relative to the portfolios that a normal investor can generate for themselves after trading costs. Despite my frequent use of ETFs in my personal investing, many retirement accounts still use mutual funds as a major source of their investing. When it comes to assessing the mutual funds, one of my earlier favorites is the Vanguard Dividend Appreciation Index Fund (MUTF: VDADX ). Largest Holdings I’m starting the analysis by looking at the largest holdings in VDADX. As you can guess from the name, there is a heavy emphasis on receiving dividends from the portfolio. (click to enlarge) The holdings are a little on the heavily concentrated side with several holdings over 3%, and it is interesting that the fund opted to include heavyweights on both Coke (NYSE: KO ) and Pepsi (NYSE: PEP ). However, I don’t see any real disadvantage to holding both for better diversification since the investor won’t be stuck paying trading costs to buy each individually. The thing that really stands out to me is that there is no Exxon Mobil (NYSE: XOM ) or Chevron Corporation (NYSE: CVX ) in the top 10. XOM is yielding over 3.5% and CVX is up near 5%. That really concerns me. Though I did not chart the rest of the top 100 holdings, I did scan through them looking for Exxon or Chevron. Neither was included anywhere in the top 100 holdings. Granted oil prices are plummeting and oil stocks may seem “risky”, but a small inclusion would be entirely appropriate for a portfolio focused on dividends. The yields are high, and the companies would benefit from higher gas prices while many parts of the economy would be disadvantaged by high fuel prices. For diversification purposes, it is very strange not to have them included. On the other hand, Vanguard is including quite a few other holdings that I wouldn’t put at the top of the list for a fund focused on dividends. For instance, Costco (NASDAQ: COST ) is included in the portfolio despite having a yield of only 1.09%. There is nothing wrong with Costco as a company from my perspective, but the portfolio already has quite a bit of retail exposure and is lacking in the big gas companies. Diversification Benefits The correlation to SPY is just under 97%, so diversification benefits are not very substantial. However, the volatility on the fund is materially lower at only 87% of the level on SPY, which is nice for investors who would prefer more stability in their portfolio values. Yield & Taxes The SEC yield is 2.19%. Again, this feels fairly low for a dividend portfolio and brings me back to the question of why companies like Chevron were not given a prominent weighting in the portfolio. Expense Ratio The mutual fund is posting an expense ratio of .10%. I want diversification, I want stability, and I don’t want to pay for them. An expense ratio of .10% is absolutely beautiful and makes VDADX a solid choice for investors. Sector Allocations To go a little deeper into the absence of the major oil companies I like to see included in a dividend growth portfolio, I grabbed a chart of the sector allocations. (click to enlarge) As you can see, the oil and gas sector was only 1.3% for the fund. That matches the index that the fund is tracking; however, I find it interesting that the index was designed to limit the exposure to oil and gas. If I were establishing a dividend index for a fund that could be used as a major portion of an investor’s portfolio, I would want to increase the oil and gas weightings to around 10%. The other interesting factor is that utilities are also mostly absent. Unless the investors are buying utility companies themselves, the ideal allocation, in my opinion, would include a higher weighting for utilities in the 10% to 15% range. Conclusion For investors looking at the very long-term picture, the extremely low expense ratio is beautiful. Vanguard has been one of the best in the business at creating low-fee mutual funds. I don’t think a fund should be chosen purely for the expense ratio, but I do believe investors should be very aware of it. When I’m putting together hypothetical portfolio positions, one of the things I include is the expense ratio on the individual positions to track the overall expense ratio on the portfolio. The overall portfolio looks solid with the exception that oil and gas is largely absent and the utility sector is strangely underrepresented despite several utility companies having strong yields. If I were using VDADX as a core holding in my retirement accounts, I would want to complement it with specifically increasing allocations to large-cap oil and gas companies and a geographically diversified group of utility companies. Disclosure: I/we have no positions in any stocks mentioned, and no plans to initiate any positions within the next 72 hours. (More…) I wrote this article myself, and it expresses my own opinions. I am not receiving compensation for it (other than from Seeking Alpha). I have no business relationship with any company whose stock is mentioned in this article. Additional disclosure: Information in this article represents the opinion of the analyst. All statements are represented as opinions, rather than facts, and should not be construed as advice to buy or sell a security. Ratings of “outperform” and “underperform” reflect the analyst’s estimation of a divergence between the market value for a security and the price that would be appropriate given the potential for risks and returns relative to other securities. The analyst does not know your particular objectives for returns or constraints upon investing. All investors are encouraged to do their own research before making any investment decision. Information is regularly obtained from Yahoo Finance, Google Finance, and SEC Database. If Yahoo, Google, or the SEC database contained faulty or old information it could be incorporated into my analysis.