Tag Archives: earnings-center

Time To (Re)Focus On AllianzGI’s Convertible/Income Bond Fund

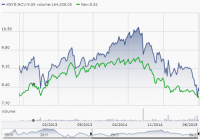
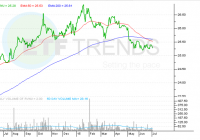
Summary For the first time in three years, NCV has traded at a discount to trading price, and this prompted the need for a review of the fund. Since my last NCV/NCZ primer (NCZ/NCV Primer), both NCV/NCZ have maintained their monthly distributions and investors have collected approximately 18% in dividend income. NCV remains a great investment vehicle for yield hungry investors with a healthy debt maturity and sector mix. The markets have been nothing close to stable for the last few weeks and this has led to the broader investment community to lose focus on their investment objectives and strategies (I mean both retail and institutional investors). For the first time in three years, the AllianzGI Convertible & Income Fund (NYSE: NCV ) has traded at a discount to trading price, and this prompted the need for a review of the fund. First off, this isn’t the first time it has happened (the price to trade below the net asset value). NCV has dipped below it’s net asset value several times historically in similar fashions – generally in response to drastic market events (in this case it’s Greece’s and Puerto Rico’s debt default scares). When the markets edge lower, like they have in the last three weeks, and many investment vehicles are impacted due to this concern, I refer to it as ” headline risk ” and without a question, the current headline risk with Greece is not good, but it isn’t going to be THAT bad for the global economy. Investors should remember/realize what exactly is at play here. In this case, it is a country defaulting/postponing/determining how to payoff debt to an entity that is unlevered and does not contain counter party risk (IMF, Germany, European Union, all other creditors). Investors, and the rest of the investment community, should realize that Greece’s headline risk is fairly isolated from investment vehicles like NCV (and the AllianzGI Convertible Fund II (NYSE: NCZ )), which trade and are meant to be benchmarked against convertible bond indices. Therefore, I felt it is time to refocus closed end fund investors back on to NCV, where global macro headline risk should not dictate the performance of convertible funds of U.S. denominated equities. Since my last NCV/NCZ primer ( NCZ/NCV Primer ), both NCV/NCZ have maintained their monthly distributions and investors have collected approximately 18% in dividend income and have been able to book 22% of returns assuming dividends were reinvested. To review the fund’s strategy, NCV invests in short to medium term convertible bonds of companies based in the United States mainly and they achieve a 12% distribution rate by levering their assets by around 33% at all times to benefit from the increased investment, and generate the high monthly distributions of approximately 13% (based on recent price levels). NCV achieves these returns in two main forms: Direct investment into convertible debt via underwritings and secondary market trading. Intra-day trading based on market opportunities to capture mispriced debt events. The downside of NCV’s strategy is that it can face liquidity constraints for some of its debt and may take on the wrong positions which will impact NAV, but difficult to compute on the market price front, making the performance of the current investments fairly difficult to transcribe. NCV Market Price vs. Net Asset Value Price Chart – NCV trades at a healthy premium to the funds net asset value price and for the right reasons… Yield demand. Source: Morningstar As shown above, NCV has consistently traded above its Net Asset Value, and this is largely due to the fact that NCV pays out a substantial dividend compared to other closed end funds. Since NCV consistently yields a monthly 12% (13% at current trading prices), investors made up of both retail and institutional distinctions have found that a 12% distribution rate is very attractive considering it can be a long term investment and executed by a reputable investment manager, Allianz. Investors do not mind paying a slight premium on the fund for the return of an above average distribution rate. NCV Annual Returns vs. Convertible Bond Benchmarks – NCV sell-off is a market overreaction (click to enlarge) Source: Morningstar Above, NCV’s trading price is compared to its convertible benchmark and based on the above chart, YTD 2015 is one of the first times where you see a divergence of NCV’s share price vs. convertible benchmark prices, outlining this investment opportunity. Generally, NCV has been able to beat this index by maintaining an active investment portfolio of convertible debt, granting positioning options the convertible bond index does not benefit from (since it is a passively tracked index). NCV Asset Allocation – The majority of the assets are in Convertible debt, which is concentrated in the United States and far from Europe Source: Morningstar To highlight why I wanted to publish this article, above is a pie chart of NCV’s asset allocation, of which is made up of 75%+ U.S. denominated debt and far from European risk. Just for clarification, the above chart is from Morningstar.com and Morningstar’s asset allocation for closed end funds is automated, confusing investors slightly since convertible debt can be identified as either “bonds” or “other” for various securities. In this case, the bonds and other categories are the convertible debt categories. NCV Bond Maturity Breakdown – With medium-term debt making up the majority of the investment portfolio, AllianzGI portfolio managers can maintain the portfolio mix for long-term investors… (click to enlarge) Source: Morningstar NCV Distributions – Investors should not see the distribution mix change, with focus to remain in distributing income to investors long term. Source: Morningstar Finally, I wanted to highlight several other factors that can help investors refocus on NCV. First, the income distributions are almost completely made up of convertible debt income funds and therefore gives investors the stability of payments since the bulk of the payouts are not driven by intra-day trading bets/performance/strategies, unlike other closed end funds. Second, the recent market price drop can be tied to the headline risk I mentioned/discussed earlier and the fact that NCV holds a portion of U.S. stock holdings in its portfolio, capturing some of the downside that the broader markets have locked onto. Third, investors who originally invested in NCV remain yield hungry and the closed end fund substitutions aren’t really here (there are only a few closed end funds that focus on convertible bonds and simultaneously yield 12% to investors). In my view, the price drop will be corrected back upward after investors have had time to digest the headline risk from Europe and broader market underperformance. NCV remains a great investment vehicle for yield hungry investors with a healthy debt maturity and sector mix, and investors should not mistaken the recent global economic issues with a closed end fund investing in convertible bonds. Disclosure: I am/we are long NCV, NCZ. (More…) I wrote this article myself, and it expresses my own opinions. I am not receiving compensation for it (other than from Seeking Alpha). I have no business relationship with any company whose stock is mentioned in this article.

The Right Municipal Bond ETF Right Now

Summary Puerto Rico problems raises concerns in municipal bond space. Take a look at a more conservative muni ETF that targets debt from dedicated revenue streams. Highlight of the Deutsche X-trackers Municipal Infrastructure Revenue Bond ETF. By Todd Shriber & Tom Lydon Chicago. Detroit. Puerto Rico. Increasingly precarious financial positions in those cities and territories and others across the U.S. have cast a pall over the municipal bond market. The cases of Chicago, Detroit and other cities across the U.S., including several mid-sized cities in California, underscore the pressure public pensions and post-employment benefits, such as healthcare for public workers, are putting on state and municipal finances. Those weakening financial positions are prompting advisors and investors to consider alternatives to general obligation bonds when building out the municipal section of fixed income portfolios. There is an exchange traded fund for that and that fund is the Deutsche X-Trackers Municipal Infrastructure Revenue Bond Fund (NYSEArca: RVNU ) . RVNU seeks to limit or reduce exposure to public pension risk, not avoid or eliminate it, by focusing solely on bonds that fund, state and local infrastructure projects such as water and sewer systems, public power systems, toll roads, bridges, tunnels, and many other public use projects where the interest and principal repayments are generated from dedicated revenue sources. Toll roads, tunnels and water systems may not sound like the sexiest investment themes, but with public pension issues afflicting states from New Jersey to Pennsylvania to California, revenue bonds, including those held by RVNU, can be seen as the “new black” of the municipal bond market. “RVNU allows us to offer a product that focuses on investment-grade revenue bonds,” said Deutsche Asset & Wealth Management (Deutsche AWM) Portfolio Manager Blair Ridley in an interview with ETF Trends. “We focus on revenue issuers that by that heir nature usually carry less pension risk as compared to general obligation issuers. We’re trying to follow those issues with dedicated revenue streams, or ‘essential purpose bonds. In any economic environment, people will pay their electric bill and their water bill.” RVNU’s index is intended to track federal tax-exempt municipal bonds that have been issued with the intention of funding, state and local infrastructure projects such as water and sewer systems, public power systems, toll roads, bridges, tunnels, and many other public use projects. The index will attempt to only hold those bonds issued by state and local municipalities where the interest and principal repayments are generated from dedicated revenue sources. A succinct way of highlighting RVNU’s utility in the current municipal bond market environment comes courtesy of Deutsche AWM portfolio manager Ashton Goodfield. She said, “RVNU has less exposure to headline risk. The revenue streams are more stable in up and down economic environments. These revenue streams are what pays back principal and interest on the bonds.” RVNU is just over two years old holds 44 bonds. The ETF’s underlying index, the DBIQ Municipal Infrastructure Revenue Bond Index, holds over 800 bonds. As Ridley notes, RVNU has “a lot of room to add holdings.” RVNU employs a representative sampling methodology in order to match the traits and returns of its underlying index. RVNU has the flexibility to go as far down the ratings spectrum as BBB, but bonds rated either AA or A currently comprise over 86% of RVNU’s index, according to issuer data. At a time of heightened concerns regarding bond liquidity, RVNU ensures liquidity by tilting more than 75% of the fund’s lineup to issues with $100 million or more outstanding. Another obvious concern is rising interest rates and how higher rates will affect longer duration bond funds. RVNU’s index has a modified duration of 6.53 years. That longer duration has been something of a hurdle for RVNU, but one the ETF can easily overcome. “Our focus is on finding the most attractive part of the yield curve,” adds Ridley. “RVNU finds bonds with 10-year calls because those have the same sensitivity as bonds with 10-year maturities.” Since coming to market, RVNU has taken its lumps. The ETF debuted in the midst of the 2013 taper tantrum and the Detroit bankruptcy, but at a time when some of the largest U.S. states, including California and Illinois, are awash in massively under-funded public employee pension obligations, some investors are looking to diversify away from GO bonds while still keeping exposure to munis. “Clients are asking about GOs and pensions,” said Goodfield. “There are some municipalities that aren’t managing these issues well. While true, we think it’s important to say many general obligation issuers are managing these issues well Some investors have a negative outlook and want to be solely in revenue bonds.” As Goodfield notes, awareness of public pension issues is on the rise. That could prove to be good for RVNU over the long-term. Deutsche X-Trackers Municipal Infrastructure Revenue Bond Fund (click to enlarge) Tom Lydon’s clients own shares of RVNU. Disclosure: I/we have no positions in any stocks mentioned, and no plans to initiate any positions within the next 72 hours. (More…) I wrote this article myself, and it expresses my own opinions. I am not receiving compensation for it. I have no business relationship with any company whose stock is mentioned in this article.

How To Avoid The Worst Sector ETFs: Q2’15 In Review

Summary The large number of ETFs has little to do with serving your best interests. Below are three red flags you can use to avoid the worst ETFs. The following presents the least and most expensive sector ETFs as well as the worst overall sector ETFs per our 2Q15 sector ratings. Question: Why are there so many ETFs? Answer: ETF providers tend to make lots of money on each ETF so they create more products to sell. The large number of ETFs has little to do with serving your best interests. Below are three red flags you can use to avoid the worst ETFs: 1. Inadequate Liquidity This issue is the easiest to avoid, and our advice is simple. Avoid all ETFs with less than $100 million in assets. Low levels of liquidity can lead to a discrepancy between the price of the ETF and the underlying value of the securities it holds. Plus, low asset levels tend to mean lower volume in the ETF and larger bid-ask spreads. 2. High Fees ETFs should be cheap, but not all of them are. The first step here is to know what is cheap and expensive. To ensure you are paying at or below average fees, invest only in ETFs with total annual costs below 0.54%, which is the average total annual cost of the 187 U.S. equity Sector ETFs we cover. Figure 1 shows the most and least expensive Sector ETFs. ProShares provides three of the most expensive ETFs while Vanguard ETFs are among the cheapest. Sources: New Constructs, LLC and company filings Investors need not pay high fees for quality holdings. The Consumer Staples Select Sector SPDR ETF (NYSEARCA: XLP ) earns our Very Attractive rating and has low total annual costs of only 0.17%. On the other hand, the Schwab U.S. REIT ETF (NYSEARCA: SCHH ) holds poor stocks. No matter how cheap an ETF, if it holds bad stocks, its performance will be bad. The quality of an ETF’s holdings matters more than its price. 3. Poor Holdings Avoiding poor holdings is by far the hardest part of avoiding bad ETFs, but it is also the most important because an ETF’s performance is determined more by its holdings than its costs. Figure 2 shows the ETFs within each sector with the worst holdings or portfolio management ratings . Figure 2: Sector ETFs with the Worst Holdings Sources: New Constructs, LLC and company filings PowerShares appears more often than any other providers in Figure 2, which means that they offer the most ETFs with the worst holdings. Our overall ratings on ETFs are based primarily on our stock ratings of their holdings. The Danger Within Buying an ETF without analyzing its holdings is like buying a stock without analyzing its business and finances. Put another way, research on ETF holdings is necessary due diligence because an ETF’s performance is only as good as its holdings’ performance. PERFORMANCE OF ETF’s HOLDINGS = PERFORMANCE OF ETF Disclosure: David Trainer and Max Lee receive no compensation to write about any specific stock, sector, or theme. Disclosure: I/we have no positions in any stocks mentioned, and no plans to initiate any positions within the next 72 hours. (More…) I wrote this article myself, and it expresses my own opinions. I am not receiving compensation for it. I have no business relationship with any company whose stock is mentioned in this article.