Tag Archives: earnings-center

5 Mid-Cap Growth Mutual Funds For High Return

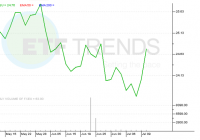
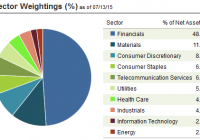
Mid-cap funds are an ideal investment options for investors looking for high return potential that comes with lower risk than small-cap funds. Mid-cap funds are not very susceptible to volatility in broader markets, making it an ideal bet given that macroeconomic conditions have generally offered a roller-coaster ride in recent years. Meanwhile, when capital appreciation over the long term takes precedence over dividend payouts, growth funds become a natural choice for investors. These funds focus on realizing an appreciable amount of capital growth by investing in stocks of firms whose value is projected to rise over the long term. However, a relatively higher tolerance to risk and the willingness to park funds for the longer term are necessary when investing in these securities. This is because they may experience relatively more fluctuations than other fund classes. Below we will share with you 5 buy ranked mid-cap growth mutual funds. Each has earned either a Zacks Mutual Fund Rank #1 (Strong Buy) or a Zacks Mutual Fund Rank #2 (Buy) as we expect these mutual funds to outperform their peers in the future. Janus Enterprise S (MUTF: JGRTX ) seeks capital appreciation over the long run. JGRTX invests a minimum of half of its assets in common stocks of companies having market capitalizations similar to those listed in the Russell Midcap Growth Index. JGRTX invests in companies that are believed to have above-average growth prospects. JGRTX may invest in companies located outside the US including those from emerging nations. The Janus Enterprise S fund has returned 6.8% over the year-to-date frame. Brian Demain is the fund manager and has managed JGRTX since 2007. Neuberger Berman Mid Cap Growth A (MUTF: NMGAX ) invests a large chunk of its assets in companies having market cap size identical to those included in the Russell Midcap Index. NMGAX maintain a diversified portfolio by investing in common stocks of companies across a wide range of sectors and industries. NMGAX may focus on specific sectors that are expected to gain from market or economic trends. The Neuberger Berman Mid Cap Growth A fund has returned 12.3% over the year-to-date frame. As of May 2015, NMGAX held 104 issues with 1.71% of its assets invested in O’Reilly Automotive Inc. TIAA-CREF Mid-Cap Growth Premier (MUTF: TRGPX ) seeks total return through long-term growth of capital. TRGPX invests a major portion of its assets in equity securities of companies having market capitalizations within the range of the Russell Midcap Growth Index. TRGPX primarily emphasizes on acquiring securities of domestic companies with favorable growth potentials. The TIAA-CREF Mid-Cap Growth Premier fund has returned 7% over the year-to-date frame. TRGPX has an expense ratio of 0.62% as compared to category average of 1.30%. Dreyfus Mid-Cap Growth F (MUTF: FRSPX ) invests a lion’s share of its assets in growth companies having market capitalizations within the universe of the Russell Midcap Growth Index. FRSPX may invest a maximum of 30% of its assets in securities of non-US companies. FRSPX may invest up to 25% of its assets in a particular foreign country. The Dreyfus Mid-Cap Growth F fund has returned 5.5% over the year-to-date frame. As of May 2015, FRSPX held 59 issues with 2.79% of its assets invested in Imax Corp. PRIMECAP Odyssey Aggressive Growth (MUTF: POAGX ) seeks capital growth over the long run. POAGX invests in common stocks of domestic companies having an impressive growth prospect. Though POAGX invests in companies irrespective of market capitalizations, POAGX invests a notable portion of its assets in mid and small cap firms. The PRIMECAP Odyssey Aggressive Growth fund has returned 7.7% over the year-to-date frame. POAGX has an expense ratio of 0.62% as compared to category average of 1.30%. Original Post

A Europe ETF For Coping With Greek Drama

Summary Greece has been a major cause for concern in the Eurozone. Recent financial drama has contributed to increased volatility. Investors who are still interested in Europe exposure, but are wary of heightened volatility, can utilize a relatively new low-vol ETF option. Greece’s status as a member of the Eurozone is solidified, at least for now and at least until more financial problems crop up there. Eurozone leaders agreed to a third bailout package for Greece, helping the country once again stave off financial disaster and potential departure from the Eurozone Last week, the volatile Greek government submitted reform proposals to Eurozone officials in an effort to secure further bailout aid. Eurozone officials reviewed the package this weekend, potentially setting Greek stocks up for more early-week volatility next week. Without a third bailout, Greece likely defaults on its obligations and departs from the Eurozone. While the Greek crisis has tried investors’ patience when it comes to Europe, select exchange-traded funds offer investors the opportunity to remain long European equities while minimizing Greece exposure and volatility. A weakening euro is likely to play a prime role in the direction of European stocks in the coming months. “The 17% drop in the value of the euro relative to the US dollar since June 30, 2014, coupled with the tremendous run-up in European equities earlier this year, begs the question: Where do Eurozone equities go from here? Historically, the year-over-year change in the EUR/USD exchange rate has led the direction of the Euro Stoxx 50 Index by approximately one year. Therefore, euro weakness in the past portends continued upside for Eurozone equities, in my view,” according to a recent note from Invesco PowerShares . The PowerShares Europe Currency Hedged Low Volatility Portfolio (NYSEARCA: FXEU ) is one avenue to consider for investors looking to profit from a falling euro while minimizing European equity market volatility . FXEU tracks members of the S&P Eurozone BMI Index to form the S&P Eurozone Low Volatility USD Hedged Index that displayed the lowest volatility over the trailing 12 months. FXEU, which debuted in May, combines the red-hot themes of currency hedging and low volatility in one ETF. Investors have warmed to the concept as FXEU has hauled in $39.3 million in assets in barely more than two months on the market. “Given the potential upside of equity exposure to the Eurozone (for reasons outlined above), the risk associated with the rise in valuation levels and the ongoing uncertainty associated with a potential Greek exit from the Eurozone (or “Grexit”), I believe a volatility-managed solution may be a sensible approach for investors to gain exposure to this critical region. In addition, I believe the divergent monetary policy between the European Central Bank and the Federal Reserve highlights the downside risk to the value of the euro and emphasizes the need for investors to consider a currency hedge to mitigate the foreign exchange risk. A currency-hedged low volatility approach provides investors the opportunity to participate in the upside in the face of stretching valuations and exchange rate risk, as well as a downside risk mitigation smart beta strategy,” adds PowerShares. Not surprisingly, FXEU’s volatility-reducing efforts include eschewing Greek stocks. As of the end of the second quarter, the ETF’s underlying index allocated a combined 54.9% of its weight to Germany and France, the Eurozone’s two largest economies. Outside of a 12.3% weight to Spain, the index’s PIIGS exposure is light and does not include Greece or Portugal. PowerShares Europe Currency Hedged Low Volatility Portfolio (click to enlarge) Disclosure: I/we have no positions in any stocks mentioned, and no plans to initiate any positions within the next 72 hours. (More…) I wrote this article myself, and it expresses my own opinions. I am not receiving compensation for it. I have no business relationship with any company whose stock is mentioned in this article.

Wide Moat ETF Gets An International Counterpart

Summary Popular economic moat ETF strategy goes international. Highlight the new market Vectors Morningstar International Moat ETF. A closer look at the economic moat strategy. The popular Market Vectors Wide Moat ETF (NYSEARCA: MOAT ) got an international equivalent today with the debut of the Market Vectors Morningstar International Moat ETF (NYSEARCA: MOTI ). MOTI tracks the Global ex-US Moat Focus Index (MGEUMFUN), “a rules-based, equal-weighted index intended to offer exposure to 50 attractively priced companies outside the U.S. with sustainable competitive advantages according to Morningstar’s equity research team,” according to Market Vectors . Like its U.S.-focused counterpart, MOTI uses Morningstar’s proprietary methodology to identify companies with long-term advantages, which allows companies to earn sustainable excess economic profits , as measured by the return on invested capital relative to the company’s cost of capital. The new ETF features exposure to 16 countries, including four emerging markets. However, MOTI’s geographic lineup is heavily tilted toward developed markets. India, China, Mexico and Chile – MOTI’s four emerging markets exposure – combine for just over a quarter of the new ETF’s weight. Conversely, Australia alone is 21.1% of MOTI’s weight. Home to 51 stocks, MOTI’s lineup is roughly two and a half times the size of MOAT’s. However, MOTI applies the same equal-weight methodology. MOAT’s 21 holdings have weights ranging from 4.64% to 6%, whereas MOTI’s holdings range in size from 1.15% to 2.32%. Four of MOTI’s top 10 holdings are Indian stocks, making the country the most represented among MOTI’s top 10 lineup. ” MOAT resonated with investors and with much of the world’s investable opportunities outside the United States, we’re launching MOTI as a means to capture moat-based opportunities abroad,” said Brandon Rakszawski, product manager at Van Eck Global, in a statement. “Morningstar is a leader in equity research and we look forward to offering investors the ability to access its analysts’ best ideas through an investible ETF.” At the sector level, MOTI is heavily allocated to financial services names with that sector commanding nearly 49% of the ETF’s weight. Materials at almost 12% is the only other sector to garner a double-digit allocation. Consumer discretionary and staples names combine for just over 15% of MOTI’s weight, according to Market Vectors data. Familiar individual names in MOTI’s lineup include State Bank of India, Unilever (NYSE: UN ), America Movil (NYSE: AMX ), Westpac Banking (NYSE: WBK ), Nestle ( OTCPK:NSRGY ), Potash Corp. (NYSE: POT ), HSBC (NYSE: HSBC ) and all of Canada’s major banks. MOAT’s methodology has clearly been embraced by investors. The ETF has swelled to nearly $881 million in assets under management in just over three years of trading. MOTI’s annual expense ratio is 0.56%. MOTI Sector Weights Chart Courtesy: Market Vectors Disclosure: I/we have no positions in any stocks mentioned, and no plans to initiate any positions within the next 72 hours. (More…) I wrote this article myself, and it expresses my own opinions. I am not receiving compensation for it. I have no business relationship with any company whose stock is mentioned in this article.