Tag Archives: earnings-center

Apple Teaches Another Lesson In ETF Weighting

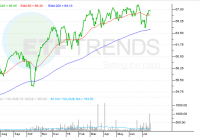
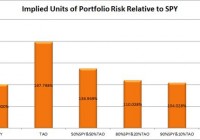
Summary Apple’s stock price fell in response to disappointing numbers. Due to its large market capitalization, the company’s moves will affect sector ETFs, notably those that track the tech industry. Alternatively, investors can use ETFs that track equal-weight methodologies to diminish the effect AAPL has on a tech sector investment. By Todd Shriber & Tom Lydon Shares of Apple (NASDAQ: AAPL ) fell 4.3% Wednesday, and at one point during the session, the iPhone maker was lighter by $60 billion in market value, after the company “disappointed” Wall Street by reporting that fiscal third-quarter profit rose “slightly” to $10.7 billion from $7.74 billion on revenue of “just” $49.61 billion. Apple’s Wednesday woes are, predictably, having a dour effect on the exchange traded funds that feature heavy allocations to the iPad maker. For example, the Technology Select Sector SPDR ETF (NYSEARCA: XLK ), the largest technology ETF by assets, has an almost 18% weight to Apple, enough to have the fund trading lower by 1.5% today. XLK’s Wednesday decline, and those of rival technology ETFs with significant Apple weights, reminds investors of the potential dangers of owning a fund with large weights to just one or two stocks. “Apple is a top-10 holding in 98 equity ETFs according to S&P Capital IQ. Besides being the largest stock, ETFs tied to the S&P 500 index like Vanguard S&P 500 ETF (NYSEARCA: VOO ) and the Russell 1000 like the iShares Russell 1000 ETF (NYSEARCA: IWB ), the technology giant is more heavily weighted in popular tech-laden products,” according to S&P Capital IQ. The PowerShares QQQ Trust ETF (NASDAQ: QQQ ), the NASDAQ-100 (NDQ) tracking ETF, entered Wednesday with a roughly 14% weight to Apple, enough to send that ETF lower by more than 1%. The $2.9 billion iShares U.S. Technology ETF (NYSEARCA: IYW ) is perhaps the epitome of an “Apple ETF” with a 20.9% weight (as of July 21) to the stock. That big Apple weight was enough to drag IYW lower by almost 2% yesterday. As S&P Capital IQ notes, there are ways to maintain tech sector exposure via ETFs while mitigating Apple or any other single stock risk. The First Trust NASDAQ-100 Equal Weight Index ETF (NASDAQ: QQEW ) and the Direxion NASDAQ-100 Equal Weighted Index Shares ETF (NYSEARCA: QQQE ) are equal-weight alternatives to QQQ. No stock accounts for more than 1.2% of QQEW’s weight and QQQE had 1% weight to its constituents at the end of the second quarter, according to issuer data . Those ETFs lost about a third of a percent yesterday. The rub is that when Apple performs well, QQQE and QQEW will lag QQQ. Even with Wednesday’s slide, Apple is up more than 13% this year, helping QQQ to a 9% gain, better than double the returns of QQQE and QQEW. The $954.2 million Guggenheim S&P Equal Weight Technology ETF (NYSEARCA: RYT ) has a weight of less than 1.6% to Apple. That is less than the ETF’s weight to Facebook (NASDAQ: FB ), eBay (NASDAQ: EBAY ) and Visa (NYSE: V ). S&P Capital IQ has market weight ratings on QTEW and RYT. Direxion NASDAQ-100 Equal Weighted Index Shares ETF (click to enlarge) Tom Lydon’s clients own shares of Apple, Facebook and QQQ. Disclosure: I am/we are long QQQ, AAPL, FB. (More…) I wrote this article myself, and it expresses my own opinions. I am not receiving compensation for it. I have no business relationship with any company whose stock is mentioned in this article.

TAO: Real Estate In China Offers More Risk Than Returns

Summary TAO has been fairly volatile and feels even more dangerous to me because I’m bearish on China. Due to a low correlation with SPY, TAO would appear to fit reasonably in a diversified portfolio. The long term challenge for TAO is very high expense ratios that eat into any returns the ETF produces. Despite a high expense ratio, the holdings are fairly concentrated which may be one reason for the high volatility on the ETF. The Guggenheim China Real Estate ETF (NYSEARCA: TAO ) seeks to track the performance of the AlphaShares China Real Estate Index. I have to admit that I’m biased in looking at TAO as an investment because I’m a large bear on China. I believe equity values have been moving too high and domestic retail investors are holding meaningful positions in the Chinese equity market. If the market turns south it won’t just be a loss of equity valuations, it will mean less cash available for the domestic investors to spend on their other life expenses. In my opinion, that compounds the problem of holding exposure to China. Risk When measuring the historical volatility of investments in the SPDR S&P 500 Trust ETF ( SPY), the monthly standard deviation of returns has been almost twice as high as the deviation for SPY since the start of 2008. On the other hand, the correlation on monthly returns was only 65.5% which is fairly attractive. I put together a chart showing the changes in risk between holding a position that is simply invested in the S&P 500 versus mixing some TAO into the portfolio. (click to enlarge) Despite the very high level of risk for TAO, the low correlation does help it fit within the context of a portfolio. I’m not big on investing in China, but for investors that want to buy REIT exposure in China the added volatility at 5% of the portfolio isn’t too bad. Liquidity is challenging The average trading volume is only around 90,000 shares per day. If looking to invest in TAO, I would be applying a liquidity premium to the minimum acceptable level of expected returns. Yield The distribution yield is 2.33%. For being classified as real estate, the distribution is not as high as I would like to see it. When you see high volatility, low liquidity, and weak yields it is creating the perfect storm for investors to lose part of their portfolio since panic in selling could result in some fairly awful prices being realized. Expense Ratio The gross expense ratio is .95% and the net expense ratio is .71%. Simply put, that is way higher than what I am willing to pay on any ETF investment regardless of the exposure. These niche investment areas can result in fairly weak competition and fairly high expense ratios. Largest Holdings The diversification within the portfolio is fairly weak. Just over 50% of the value of the portfolio came from the top 10 holdings. (click to enlarge) Conclusion I’m bearish on China and I’ve found an international REIT ETF that offers investors high volatility, high expense ratios, and only moderate levels of diversification. It’s too bad investors can’t actually short stocks with no trading costs the way economic theory suggests. With such a high expense ratio it would be tempting to short the ETF and go long the underlying stocks to obtain the alpha from avoiding the expense ratio. Too bad it doesn’t work like that in the real world. That leaves me with no better option than just avoiding this investment. I wasn’t bearish on China a year ago. When the prices were more reasonable, I had no problem with exposure to the Chinese equity market. On fundamental valuations the market may not seem too bad, but any weakness could hurt the consumers which would hurt the fundamentals of the companies. If the prices fell far enough after adjusting for declining fundamentals, I wouldn’t mind buying exposure to China again. However, if I did that I would still be looking to get that exposure with a much lower expense ratio. Disclosure: I/we have no positions in any stocks mentioned, and no plans to initiate any positions within the next 72 hours. (More…) I wrote this article myself, and it expresses my own opinions. I am not receiving compensation for it (other than from Seeking Alpha). I have no business relationship with any company whose stock is mentioned in this article. Additional disclosure: Information in this article represents the opinion of the analyst. All statements are represented as opinions, rather than facts, and should not be construed as advice to buy or sell a security. Ratings of “outperform” and “underperform” reflect the analyst’s estimation of a divergence between the market value for a security and the price that would be appropriate given the potential for risks and returns relative to other securities. The analyst does not know your particular objectives for returns or constraints upon investing. All investors are encouraged to do their own research before making any investment decision. Information is regularly obtained from Yahoo Finance, Google Finance, and SEC Database. If Yahoo, Google, or the SEC database contained faulty or old information it could be incorporated into my analysis.

Nasdaq And Emerging Market: 2 ETFs Trading With Outsized Volume

In the past trading session, U.S. stocks were in the bearish territory as an overall negative tone from recent earnings took a beating on the market. For the top ETFs, investors saw the S PDR S&P 500 Trust ETF (NYSEARCA: SPY ) shed 0.6%, the SPDR Dow Jones Industrial Average ETF (NYSEARCA: DIA ) lose over 0.6% and the PowerShares QQQ Trust ETF (NASDAQ: QQQ ) move down by about 0.4% on the day. Two more specialized ETFs are worth noting though as both saw trading volume that was far outside of normal. In fact, both these funds experienced volume levels that were more than double their average for the most recent trading session. This could make these ETFs ones to watch out for in the days ahead to see if this trend of extra-interest continues: This Nasdaq-100 equal weighted ETF was in focus yesterday as roughly 308,000 shares moved hands compared to an average of roughly 87,000 shares. We also saw some stock price movement as QQEW lost about 0.04%. The move was largely the result of the recent Apple-induced volatility in Nasdaq as these can have a big impact on tech stocks like what we find in this ETF’s portfolio. For the last one-month period, QQEW was down 0.7%. The fund carries a Zacks ETF Rank #3 (Hold). F lexShares Morningstar Emerging Markets Factor Tilt Index ETF (NYSEARCA: TLTE ): Volume 3.34 times average This emerging market ETF was under the microscope yesterday as nearly 55,000 shares moved hands. This compares to an average trading day of about 16,000 shares. TLTE lost about 1% on the session. The big movement can largely be blamed on the sooner-than-expected prospect of a Fed rate hike as existing home sales jumped at the fastest pace in eight years in June while median home prices hit a record high on the back of economic well-being. TLTE was down about 7% in the last one-month period and currently has a Zacks ETF Rank #3. Link to the original article on Zacks.com Share this article with a colleague