Evaluating Managers During Market Extremes
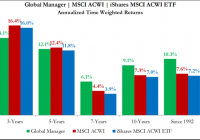
Summary Investing is a probability-based exercise; therefore, having a good decision making process is vitally important. Emotions and investing do not play well together and often lead to poor decisions. Investors should ultimately evaluate investments/managers in a way that minimizes emotional corrosion. Capital markets have a rhythm over the long term. They ebb and flow, creating investor sentiment that fluctuates between euphoria and despair. This pattern is one of the key impediments to becoming a successful investor. In order to succeed, one must master not only investment knowledge, but also investor psychology. Deciphering and filtering large amounts of data in order to make a successful investment is not enough. Investors must also control their emotions which often lead them to poor decisions. Looking at the stock markets today, the S&P 500 and the MSCI All Country World (“ACWI”) continue to climb in spite of lukewarm economic data. Through May 31st, the S&P 500 and ACWI are up 3.2% and 5.4%, respectively. This is quite a return when considering the U.S. Gross Domestic Product was reported down 0.2% for the first quarter. The three-year returns for the S&P 500 and ACWI were also very robust as these markets gained 68.0% and 53.9%, respectively. This pattern has been in place since the bottom of the market was established in early 2009. While the stock market recovery has allowed investors to regain losses from the financial crisis, the euphoria caused by accelerating markets can create doubt in one’s investment philosophy. This can overwhelm an investor’s ability to achieve their investment objectives because it can cause them to “chase returns” or “reach for yield” at the exact time in which they should be exhibiting discipline in their investment philosophy/process. At Highland, our overarching investment philosophy is one rooted in risk management. We believe investors should prudently seek return in a manner which protects them during difficult markets (i.e. large market declines). This philosophy leads us to managers which exhibit certain characteristics: Downside protection: losing less than the overall market during large, protracted declines; emphasis on intrinsic value: the price of an investment does matter; lower long-term volatility: a more consistent return pattern than the overall market (i.e. shorter peaks and troughs); and long-term time horizon: longer holding periods allows for an investment thesis to properly play out. By investing in managers which exhibit these characteristics, we believe that our investors can outperform the overall market over longer periods of time. However, in order to properly execute this philosophy, an investor must remain focused on the long term and remain patient. The goal of this approach is to enhance one’s ability to stick with their investment strategies during very difficult markets. Ironically, this investment approach tends to be most difficult to stomach during periods of rapidly appreciating markets as it and these types of managers will tend to underperform. For this reason, we will focus on evaluating managers during euphoric markets and how to determine if your objectives are still being met. Traditional Evaluation Methodology The most commonly used method to evaluate managers is to simply compare their historical performance to that of a benchmark index. While many different methods can be used, the most common method is annualized time-weighted returns. Figure 1 illustrates time-weighted returns of a global equity manager utilized by Highland: Figure 1 (click to enlarge) In order to evaluate the success of a manager, an investor must first define/understand what they mean by success. Many investors simply define success as a manager outperforming their respective benchmark. Using this measure of success, it appears that the global manager has been struggling to achieve success over the past three and five years. Based upon this analysis, an investor might be tempted to terminate the manager in search of a manager that has provided above-benchmark returns. At Highland, we believe that success is defined by an investor’s ability to achieve their long-term investment objectives. Ultimately, it is not only the return, but also how you achieve the return that determines success. We believe success is determined by the following: Outperforming the benchmark over the long term (minimum of 5-year rolling periods). Protecting capital during difficult markets. Exhibiting an overall volatility lower than the benchmark. The traditional type of analysis ultimately fails to determine success for two reasons. First, only one aspect of success (return) is being examined. Second, it can lead to poor decisions. Figure 2 compares Manager A’s and Manager B’s time-weighted returns. This chart illustrates the value added/subtracted (manager return minus benchmark return) over several time periods. Which manager would you choose? Most would pick Manager B because the value add is much higher and consistent than Manager A. The problem is that A and B are the same manager (see Figure 1 ). The only difference is that A represents data through May 31st and B represents data through February 28, 2009. This illustrates one of the major flaws with utilizing only time-weighted returns in your analysis, which is endpoint sensitivity . Figure 2 (click to enlarge) Endpoint sensitivity is a phenomenon which occurs when the conclusions of an analysis can be significantly altered by changing the ending data point (the ending date in this example). Highland’s investment philosophy employs strategies which seek to protect capital during difficult equity markets. This means that the managers in the portfolio tend to have less downside risk and lower overall volatility. Conversely, they tend to perform less well, on a relative basis, in big up markets. Therefore, this type of strategy often suffers severe endpoint sensitivity during market extremes, which was illustrated in Figure 2 . Highland’s Evaluation Methodology In order to minimize potentially erroneous conclusions caused by endpoint sensitivity, Highland employs additional analyses to evaluate manager success. The first is to consider rolling periods of compound returns (i.e. how consistent are a manager’s returns over longer periods of time). This type of analysis examines the entirety of a manager’s return stream to determine their probability of success. In addition, we examine a manager’s rolling excess performance over the benchmark to ensure consistency. By combining these two methods, we believe that we have a more predictable method of assessing whether a manager has the ability to add value. Figure 3 illustrates the global manager’s results based on this methodology. The results show that the manager has the ability to consistently outperform the benchmark, especially when examining longer time horizons (i.e. outperforming 100% of ten-year periods). This also shows how the results in Figure 1 are more driven by the extreme market environment and less by the manager’s ability to outperform. Figure 3 (click to enlarge) While the results in Figure 3 better account for endpoint sensitivity, they still only capture one aspect of success (return). To evaluate the risk aspect, Highland examines volatility and risk-adjusted returns to ensure a manager is providing the return profile required by our investment philosophy. There are numerous methods that can be used to evaluate risk-adjusted returns, and Highland uses most of them to analyze success. Figure 4 is one example, which examines return per unit of volatility over rolling periods (to eliminate endpoint sensitivity). Figure 4 (click to enlarge) Each of the methods used to evaluate success have their own set of pros and cons; therefore, one method cannot be used in isolation to properly judge a manager. Instead, Highland utilizes all of the methods discussed in order to determine if objectives are being met. This allows us to temper our emotions at market extremes and maintain sound judgment when it is the most difficult. We are then able to focus on the long term and put our clients in a position to achieve their investment objectives. Conclusion Conservative investment strategies can be beneficial for investors. They allow investors to stay calm and stick to their investment philosophy when markets are experiencing large corrections, which place an investor in the position to achieve their investment objectives over the long term. On the other hand, these types of strategies struggle to keep up with markets during long, protracted upswings, which could cause an investor to question the validity of a conservative strategy. It is important to understand that traditional evaluation tools at market extremes (i.e. peaks and troughs) often skew the appearance of success or failure. For this reason, Highland utilizes evaluation metrics that limit endpoint sensitivity. Therefore, investors can limit their emotions and make decisions in a manner that is prudent and most beneficial for their portfolio. Disclosure: I/we have no positions in any stocks mentioned, and no plans to initiate any positions within the next 72 hours. (More…) I wrote this article myself, and it expresses my own opinions. I am not receiving compensation for it. I have no business relationship with any company whose stock is mentioned in this article.