Tag Archives: china

On The Winners And Losers Of The Great Chinese Rebalance

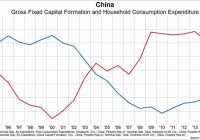
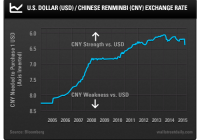
China’s economy is in the midst of a transition from an investment led growth model to a consumption led growth model. This week has seen what we believe to be an acceleration of this transition with the slight altering of China’s currency peg to the US dollar. China’s investment share of GDP must fall from 48% to 35% while consumption rises from 38% to closer to 50%, and it could take a decade. There will be winners and losers on both sides with consumer oriented plays benefiting while commodity oriented plays get pinched. Change can be hard, but change can also be good. At this very moment we are living through one of the largest and potentially destabilize periods of economic change in the last century. It is the mirror image and reversal of the last great economic paradigm shift. It is China’s shift from an investment driven growth model to a consumption driven growth model. For some it is painful. For others who are correctly positioned it is extremely lucrative. It is affecting all of us whether we know it or not. But most of all, it is inevitable. This week has seen what we believe to be an acceleration of this change. China continued to make baby steps towards liberalizing its financial system by altering – slightly – the defacto peg to the US dollar. China is notorious for “feeling the stones as [they] cross the river”, and this latest currency regime shift is just one stone of many that will eventually lead to a much more open and consumption driven economy, but it will take years. To be clear, when we say that China is shifting from an investment led economic growth model to a consumption led model, we are referring to a literal flip flop in the share of investment and consumption as a percent of GDP. As the first chart below shows, from 2000-2013, investment as a percent of China’s GDP grew from 35% to 48%. Meanwhile, consumption as a percent of GDP fell from 47% to a low of 36%. There is no correct ratio of investment as a percent of GDP, but many emerging market countries run at about 35%. This is because sustaining an abnormally high investment share of GDP – say around 48% as China has done – for a long period of time requires a massive buildup of debt which has practical limits. China is undergoing this uncomfortable shift in its economy and it will likely take a decade to get there. In the meantime, there are plenty of consequences, both good and bad, for stakeholders. (click to enlarge) From an arithmetic perspective, transitioning from 48% investment to 35% investment and from 36% consumption to 47% consumption requires three things. First, growth in investment (think infrastructure/property development) must slow dramatically from a 20% plus pace to a low single digit pace and then stay at that low single digit growth rate for some time. Second, growth in consumption expenditure must rise from the current rate of about 10% to somewhere closer to 20% and then continue to grow at 20% for some time. Third, the overall growth rate of the economy must fall from the current 7% rate to something closer to 3-4%, if not lower. In extremely simple terms, the growth rate of rail lines, apartment buildings, the occasional empty city, and everything required to make those things must fall dramatically while the growth rate of things like spending on consumer goods and health care must rise dramatically. As the next chart below demonstrates, China has made a good amount of progress on the investment side (but mind you many, many more years of even lower investment growth are ahead of us), but consumption has yet to see its required growth spurt. (click to enlarge) One of the most obvious consequences of the requisite slowdown in the rate of investment growth is the practically assured collapse in commodity prices, as we have seen. Indeed, the price of oil, copper, and raw materials more generally have been highly correlated to China’s investment share of GDP, as the next three charts below demonstrate. As China’s transition continues to play out over the next number of years, the probability of continued weakness in commodities will remain elevated. Remember, this is a potentially decade-long process that has according to our interpretation of the data just begun. (click to enlarge) (click to enlarge) (click to enlarge) On the flip side of the equation, we should also be seeing healthy growth rates in companies catering the Chinese consumer, and we are. In the two tables below we categorize all non-financial non-utility companies in the China Securities Index 300 (CSI 300) into either consumer related companies (first table) or industrial related companies (second table). We then show the aggregate annual growth rates in sales and liabilities for both of these groups. The data clearly shows stability in the top line growth rate of the consumer related companies and cratering growth among the industrial/investment related companies. Given the required duration of this transition, we think there is a high probability that we see these trends continue and even permeate more broadly into other equity markets in both the emerging and developed worlds. (click to enlarge) Source: Gavekal Capital (click to enlarge) Source: Gavekal Capital So the big question is obviously what all this means from an investment perspective. To our mind the clear takeaway is that investors should be overweight EM and DM consumer, heath care, technology, and high tech manufacturing companies with exposure to China and other emerging markets making a similar transition. These companies stand to benefit from the heightened consumption growth and the “move up the value chain” goal of many emerging market countries in terms of manufacturing. Alternatively, investors would be well suited to underweight the areas of the EM and DM stock markets with direct or indirect exposure to China including energy, materials, utilities and industrial manufacturing with a low gross profit margin (basically commodity and commodity pass through plays). The practical problem of course is that market capitalization weighted and even most smart beta ETFs that invest in EM stocks (think VWO , EEM , or DEM ) typically have high weightings to the exact areas that are most likely to see slowing growth. The same can be said for developed market ETFs such as VT , ACWI , ACWV , SDIV and URTH . The trick is to find vehicles that offer the opportunity to benefit from China’s years-long transition instead of vehicles that are in effect leaning against it. The original posting of this article can be found here . Disclosure: I/we have no positions in any stocks mentioned, and no plans to initiate any positions within the next 72 hours. (More…) I wrote this article myself, and it expresses my own opinions. I am not receiving compensation for it. I have no business relationship with any company whose stock is mentioned in this article.

Making Sense Of China’s Currency Devaluation

Alan Gula, CFA Earlier this week, two massive explosions rocked the Chinese port city of Tianjin. It’s said that the larger explosion was equivalent to over 20 tons of TNT being detonated. The blasts were so large that seismic activity was registered around 100 miles away. The exact cause of the explosions is unknown, but other shocks emanating from China have clearer triggers. On August 11, 2015, China devalued its currency, the renminbi (yuan), by 1.9%. It was the currency’s biggest one-day drop since 1994. It didn’t stop there, either. At one point the following day, the yuan had cumulatively lost as much as 3.9% of its value against the dollar. Policymakers in China seem to be following through on their promise to allow the market to play a bigger role in determining the exchange rate. “A fixed exchange rate looks stable, but it hides accumulated problems,” noted Yi Gang, Vice Governor of China’s central bank. China doesn’t have a fixed peg, but it does heavily manage the yuan’s level relative to the U.S. dollar. The chart below helps us put the devaluation into perspective. The y-axis has been inverted so that a rising line shows the yuan’s strength. As you can see, China allowed the yuan to significantly appreciate against the dollar from 2005 up until the credit crisis. The fixed peg was reinstituted from mid-2008 until mid-2010. Then, the yuan began a slower appreciation, which culminated in early 2014. So, the yuan’s relatively small recent devaluation has only given back a small portion of its longer-term appreciation. That said, we shouldn’t downplay what’s happening right now. The U.S. dollar bull market has really forced China’s hand. The dollar has been very strong over the past year against virtually all global currencies. Therefore, the yuan has been dragged higher. With a strong currency, China has lost some of its export competitiveness. China has also been burning through foreign exchange reserves to keep the yuan at a level above where it would naturally be. Given that China’s economy is slowing, its exports are flagging, and its speculative bubbles are collapsing, the move wasn’t completely unexpected. Plus, an increasingly market-driven exchange rate will pave the way for the yuan to enter the Special Drawing Rights (SDR) basket. Nonetheless, the market seemed to be surprised by the devaluation. Global equity markets dipped and the U.S. 10-year yield declined all the way to 2.05%. China’s move has sparked fears that a new wave of deflation will wash over the world. A weaker yuan will also help boost China’s exports at the expense of other nations. Koichi Hamada, an adviser to Japan’s Prime Minister, went so far as to say that Japan can offset the yuan devaluation with monetary easing. Indeed, it’s clear to see why there’s a risk of escalating competitive devaluations or “currency wars.” For individual investors, it’s important to keep everything in perspective. Just a little while ago, Greece and Europe were roiling the markets. Now, it’s China’s turn. Soon, there will be something else. If you’re getting spooked by these news-driven stock market plunges, only to buy higher after a fierce rally, you’re doing it wrong. Many traders and investors are simply getting whipsawed by the volatility. Meanwhile, the S&P 500 has effectively gone nowhere since the Fed’s latest quantitative easing (QE3) program ended. This is why everyone should hold globally diversified portfolios of stocks, preferred stocks, bonds, and real assets. There are going to be more (and much larger) disturbances down the road, and their timing is uncertain. By being properly diversified and intelligently taking on risk, you’ll protect yourself from the market shocks and volatility storms coming our way. Original Post

The Complete Guide To Consumer Staples ETFs

The consumer staple sector showed great improvement in the first half of 2015 on the back of moderate economic recovery, better job prospects, improved business and renewed optimism as a result of the housing recovery. Rising wages and cheaper fuel were the other positives. With oil and natural gas prices subsiding, consumers are left with more disposable income. Commodity costs have in many cases stabilized, which have improved profit margins for certain staples companies. Consumers are also expecting lower inflation primarily due to lower gas prices. However, the continued appreciation of the U.S. dollar relative to most foreign currencies acted as a near-term headwind to the earnings of U.S.-based staples companies with significant international operations. Other risks included potential price wars, a competitive environment, slowdown in international markets (including continued slowdown in China), political turmoil in Russia, sluggishness in Japan and an unfavorable economic environment in Europe. Industry players like McCormick & Co., Inc. (NYSE: MKC ), Energizer Holdings, Inc. (NYSE: ENR ), General Mills, Inc. (NYSE: GIS ), Molson Coors Brewing Co. (NYSE: TAP ), Tyson Foods, Inc. (NYSE: TSN ) have posted positive earnings surprises of 9.4%, 14.5%, 4.5%, 7% and 2.7%, respectively, in their recently reported quarters. On the contrary, Monster Beverage Corporation (NASDAQ: MNST ) and Sysco Corp. (NYSE: SYY ) fell short of their respective Zacks Consensus Estimate, mainly due to currency headwinds. Hopefully, the second half of the year will prove to be better for these companies with a strong rebound in earnings. Given the defensive nature of this sector, it will outperform when equity markets are more bearish and underperform when bullish. The ups and downs of the sector due to the U.S. and global exposure can be played with a wide array of ETFs. The ETFs can act as an excellent investment medium for those who wish to take a long-term exposure within the consumer staples sector. For those interested in taking a look at consumer staples, we have highlighted a few ETFs tracking the industry, any of which could be an interesting pick: Consumer Staples Select Sector SPDR ETF (NYSEARCA: XLP ): Launched on December 16, 1998, XLP is an ETF that seeks investment results corresponding to the S&P Consumer Staples Select Sector Index. This fund consists of 39 stocks of companies that manufacture and sell a range of branded consumer packaged goods, with the top holdings being The Procter & Gamble Co. (NYSE: PG ), The Coca-Cola Company (NYSE: KO ) and Philip Morris International, Inc. (NYSE: PM ). The fund’s expense ratio is 0.15% and it pays out a dividend yield of 2.56%. XLP had about $7.37 billion in assets under management as of July 2, 2015. Vanguard Consumer Staples ETF (NYSEARCA: VDC ): Initiated on January 26, 2004, VDC is an ETF that tracks the performance of the MSCI US Investable Market Consumer Staples 25/50 Index. It measures the investment return of large-, mid-, and small-cap U.S. stocks in the consumer staples sector. The fund has a total of 101 stocks, with the top three holdings being Procter & Gamble, Coca-Cola and PepsiCo, Inc. (NYSE: PEP ). It charges 0.12% in expense ratio, while the yield is 1.91% as of now. VDC has managed to attract $2.8 billion in assets under management till May 31, 2015. First Trust Consumer Staples AlphaDEX (NYSEARCA: FXG ): FXG, launched on May 8, 2007, follows the equity index called StrataQuant Consumer Staples Index. FXG is made up of 40 consumer staples securities, with the top holdings being The WhiteWave Foods Company (NYSE: WWAV ), Pilgrim’s Pride Corporation (NASDAQ: PPC ) and CVS Health Corporation (NYSE: CVS ). The fund’s expense ratio is 0.67% and the dividend yield is 1.55%. It had $2.62 billion in assets under management as of July 2, 2015. Guggenheim S&P 500 Equal Weight Consumer Staples (NYSEARCA: RHS ): Launched on November 1, 2006, RHS is an ETF that seeks investment results corresponding to the S&P 500 Equal Weight Index Consumer Staples. This is an equal-weighted fund and constitutes 37 stocks, with the top holdings being ConAgra Foods, Inc. (NYSE: CAG ), Monster Beverage Corp. ( MNST ) and Reynolds American, Inc. (NYSE: RAI ). The fund’s expense ratio is 0.40% and it pays out a dividend yield of 1.81%. RHS had about $271.0 million in assets under management as of Jul 6, 2015. Fidelity MSCI Consumer Staples ETF (NYSEARCA: FSTA ): FSTA, launched on October 21, 2013, is an ETF that seeks investment results corresponding to MSCI USA IMI Consumer Staples Index. This is a cap-weighted fund and constitutes 100 stocks, with the top holdings being Procter & Gamble, Coca-Cola and PepsiCo. The fund’s expense ratio is 0.12% and the dividend yield is 2.67%. FSTA had about $147.1 million in assets under management as of June 30, 2015. Original Post