Tag Archives: china

Income-Oriented ETF Provides Exposure To Infrastructure Boom

By DailyAlts Staff Investors seeking exposure to global infrastructure assets have a new and attractive option, thanks to the February 11 launch of the Guggenheim High Income Infrastructure ETF (NYSEARCA: GHII ). The new ETF is the first infrastructure ETF to weight its holdings according to 12-month trailing dividend yield, rather than market capitalization or some other measure. The result is an investment vehicle that provides exposure to public services, toll roads, airports, water, pipelines, utilities, and other essential services around the world, with a focus on generating current income for its investors. Global Exposure The Guggenheim High Income Infrastructure ETF tracks the S&P High Income Infrastructure Index, which is composed of the S&P Global BMI’s 50 highest-dividend-paying companies in the energy, transportation, and utilities sectors. The fund and its underlying index have a global footprint, with only about one-fifth of components domiciled in the United States. The fund’s top holdings include investments in Australia (14%), China (9%), Spain (8%), and Italy (8%); and it also has significant exposure to infrastructure assets in Britain, Canada, Singapore, and France. “The infrastructure asset class offers investors the opportunity to realize enhanced return and capital appreciation,” said a Guggenheim spokesperson. “Offering strong cash flow potential, assets with typically long life spans, as well as relatively low volatility and significant barriers to entry, infrastructure provides investors with access to an emerging segment of the market aligned with the global recovery.” Continued Infrastructure Spending The launch of the Guggenheim High Income Infrastructure ETF appears to be well-timed, as governments around the world – despite fiscal and monetary woes – are planning ambitious new rounds of infrastructure spending. Oxford Economics and PwC project global infrastructure spending will total nearly $78 trillion between 2014 and 2025; with about 60% of that attributable to the Asia Pacific. In the U.S., the White House says that infrastructure investment will continue to be needed even after the economy reaches full employment, but that “time is running out to make these needed investments under ideal economic conditions.” Shares of the Guggenheim High Income Infrastructure ETF face an expense ratio of 0.45% – two basis points less than the 0.47% charged by the rival iShares Global Infrastructure ETF (NYSEARCA: IGF ).

The U.S. Economy Recovers – GLD Comes Down

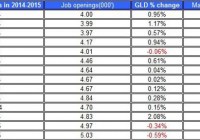
The non-farm payroll brought down GLD. Rising long-term treasury yields are keeping down GLD. It’s still uncertain where the demand for gold in China and India is heading. The recovery of the SPDR Gold Trust (NYSEARCA: GLD ) came to a halt in recent weeks as the recent economic indicators, mainly in the U.S. labor market, were better than anticipated. Let’s review the latest from the U.S. economy and its relation to the progress of GLD. The two major labor reports are the non-farm payroll and JOLTS. The non-farm payroll presented better-than-expected results. The JOLTS report was in line with market expectations. These reports suggest the U.S. economy is progressing with higher number of jobs, more job openings, and improved wages. The recent JOLTS report presented another positive gain in the number of job openings as it passed 5 million. Quit rate hasn’t changed at 1.9%, but the number of quits continues to slowly pick up, which is another positive indication for the progress in the U.S. labor force. In the past, the price of GLD tended to react strongly to the non-farm payroll report and to a lesser degree to the JOLTS report, as presented in the table below. (click to enlarge) Source of data taken from Google Finance and U.S. Bureau of Labor Statistics But the recovery in the labor market is likely to enable the FOMC, down the line, to raise rates. Higher rates in the coming months aren’t likely to do well for the price of GLD. One important issue related to the non-farm payroll report was the gain in wages – which also implies higher core inflation. After all, wages have risen by 2.2% year over year and by 0.5% compared to the previous month. (click to enlarge) Source of chart: FRED Is the current rate of gain in wages good enough for the FOMC? The chart above presents the year-over-year percent changes in U.S. wages over the past few years. The FOMC aims to reach a core inflation target of 2%, which isn’t far off the current gain in wages. Nonetheless, the growth in wages is still well below the levels recorded before the 2008 recession. So even though wages have gone up, they still have a long way to go before reaching their high levels of 2007. The other side of equation related to the labor market is the unemployment rate, which is currently at 5.7%. Back in 2007, the rate of unemployment was around 4.5%, but the FOMC’s long-term rate is around 5.3%. So the current level isn’t far off the FOMC’s long-term target, and thus, shouldn’t be among the factors holding back the FOMC from raising rates, right? (click to enlarge) Source of chart: FRED It depends on who you ask. According to a recent article by Krugman , the natural rate of unemployment is actually below 5%. Even if the rate of unemployment and wages are still off the “healthy levels”, for now, it seems a bit of stretch to consider they will be enough to impede the FOMC from raising rates in the middle of the year. One factor that has changed course in recent weeks is the rise in interest rates: The 10-year U.S. treasury yields have gone up and reached 2%. Source of data taken from U.S. Treasury and Google Finance The relation between the changes in yields and the price of GLD remains mid-strong and robust – it currently stands at -0.365. This negative relation suggests that if U.S. treasury were to keep picking up, this trend could also coincide with the drop in shares of GLD. Despite the recent fall in the price of GLD, the demand for the ETF has picked up – the ETF’s gold holdings continue to rise, as indicated in the chart below. Source of data taken from GLD’s website Keep in mind that the recent developments in Europe, including the ECB’s QE program and the higher chances (the market gives) of a Greek exit from the EU weigh on the euro. The higher uncertainty is likely to do well for the U.S. dollar, which isn’t something good for the price of GLD, but could also raise the demand for gold as an investment. Besides the changes in the demand for gold as an investment, the physical demand for gold is another, albeit secondary, factor to consider for the progress of gold prices. On this front, the leading country in consuming gold is China – the country has taken the reign from India as the leading importer of gold. In 2014, however, China’s gold consumption dropped by 25% compared to 2013. But since the beginning of the year , the demand for gold in China has started to pick up. Bear in mind, however, that China’s economy is expected to grow at a slower pace than in previous years, which may also translate to slower growth in demand for gold. India may also see a rise in gold imports if government officials were to follow through and reduce the import tax on the yellow metal. It’s still unclear where the chips will fall for gold consumption in China and India, but if these countries do surprise and show higher consumption, this could play a secondary role in raising gold prices. The rise in U.S. treasury yields and the improved U.S. labor market don’t vote well for the price of GLD. But there are also other factors to consider that could curb down the descent of gold. The uncertainty around Europe’s future and the demand for gold in China and India are question marks that could play in favor of gold. For more see: Gold and Inflation – Is there a relation? Disclosure: The author has no positions in any stocks mentioned, and no plans to initiate any positions within the next 72 hours. (More…) The author wrote this article themselves, and it expresses their own opinions. The author is not receiving compensation for it (other than from Seeking Alpha). The author has no business relationship with any company whose stock is mentioned in this article.

Policy Easing Puts China ETFs In Focus

Bad economic news continue to flow out of China, with the GDP growth rate falling to 24-year low in 2014, credit crunch concerns, a property market slump, persistently lagging manufacturing sector which contracted for the first time in two years in January 2015. Faltering demand from key export markets like Europe adds to the worries. The issues that plagued the economy in 2012 have actually resurfaced since the start of 2014. To lift the cloud over the economy, the People’s Bank of China (PBOC) surprised the global markets on February 4 with a cut in reserves requirement ratio (RRR) by 50 bps. The latest cut was the first comprehensive one in the Chinese economy after May 2012. Moreover, to boost smaller companies, the PBOC announced an additional RRR cut of 0.5 percentage point for city commercial banks and rural banks. Agricultural Development Bank of China receives a further reduction of 4 percentage points. Australia & New Zealand Banking Group Ltd. economists expect the step to add about 600 billion yuan ($96 billion) to the Chinese banking system. Prior to this, in November, PBOC had slashed one-year lending rate, for the first time in more than two years, by 40 bps to 5.6% and the deposit rate by 25 bps to 2.75%. The PBOC also gave Chinese banks more flexibility in setting the interest rates on deposits in November. Last year, China also took some easing measures including a mini-stimulus package mainly targeted at railways and other construction investment and a tax relief for small enterprises. Moreover, China slashed the RRR for rural banks and focused on innovative rural financial products hinting at the transition to domestic growth from exports. However, all its policy measures were small in scale then and appear not to have contributed significantly to the GDP picture so far. Market Reaction Several market participants expect a few more RRR and interest rate cuts this year with more evidence testifying to the fact that Chinese growth will take time to pick up due to global growth concerns. After all, solid monetary easing becomes essential for China given the sagging inflation which fell to five-year low in November. The sudden move by the People’s Bank of China, which echoes the easy policy era in China in the coming days, offered modest gains in the Chinese stocks. Several Asian markets have benefitted from this decision. In the large cap sphere, the iShares China Large-Cap ETF (NYSEARCA: FXI ) , the iShares MSCI China ETF (NYSEARCA: MCHI ) and the SPDR S&P China ETF (NYSEARCA: GXC ) all added about 1% in the key trading session. The more local China A-Shares ETFs the Deutsche X-trackers Harvest CSI 300 China A-Shares ETF (NYSEARCA: ASHR ) , the Market Vectors ChinaAMC A-Share ETF (NYSEARCA: PEK ) and the PowerShares China A-Share Portfolio ETF (NYSEARCA: CHNA ) have tacked on better gains in the range of 1% to 2.4%. Turnaround Possible in New Year? Those hoping for a turnaround might look forward to the Chinese New Year in late February this year against last year’s late January. This should boost Chinese spending, especially with the greater availability of cash following the latest rate cut. However, over the long run, the situation might moderate. We would like to take a wait and see approach for the broader China ETFs space given a sluggish global economy, though the U.S. demand looks strong. There are a number of headwinds still facing the Chinese economy, including shadow-banking activities and money laundering from mainland China to other peripheral destinations like Macau. A group of economists believe that the government’s excessive focus on anti-corruption activities may in fact hold back GDP growth. Whatever the case, we expect a host of small easing measures now and then from the PBOC as we progress along the year and as the economy comes up with downbeat readings. And whenever this happens, the market should warm up. Chinese equity ETFs are undervalued at the current level with the biggest ETF FXI trading at a P/E (ttm) multiple of 10 against the broader emerging market ETF, the iShares MSCI Emerging Markets ETF (NYSEARCA: EEM ) P/E (ttm) multiple of 12. So investors might have a short-term bet on the aforementioned ETFs to cash in on twin opportunities – the RRR cut and the other New Year spending spree.