Tag Archives: bstresource

Dominion Resources Set To Grow At Better Pace Than Its Peers

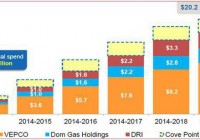
Summary Ongoing efforts to extend and improve operations will grow future top and bottom-line numbers. Company’s healthy earnings growth prospects will support cash flow base. D offers cheaper growth as compared to peers. Dominion Resources (NYSE: D ), one of the largest U.S. utility companies, has extended operations across the Mid-Atlantic region. D’s diversified electric and natural gas operations have been getting better revenue and earnings growth. As the company is increasing its growth capital expenditures to grow both electric and natural gas businesses, D’s long-term earnings growth outlook looks stable and attractive. And in fact, significant growth potential as a result of capital expenditures makes me believe the company will continue to grow its dividends at a healthy pace in the long term. The company’s earnings are expected to grow at an average rate of 6% in the next five years. Along with healthy growth prospects, the stock offers an attractive dividend yield of approximately 3%, which makes it an attractive pick for dividend-seeking investors. Elevated Growth Capital expenditure will guard D’s Long-Term Growth The U.S. utility sector has performed pretty well in 2014. And in the wake of improving economic conditions, future growth prospects of the industry also look bright. As far as D is concerned, with ongoing increases in its growth capital expenditures directed towards betterment and extension of its infrastructure and operations, the company has been strengthening its position among other utility sector giants. And in this regard, D has recently increased its long-term capital expenditure outlook from 2014-2019; the company will now spend $20.4 billion (guidance mid-point), higher than the previous forecast of $14 billion , on its various energy infrastructure projects. The value of these growth investments lies in strengthening the company’s current energy infrastructure in order to serve its customer base in a more competent and effective way. The following chart shows updated figures for the company’s increased capital expenditure on various growth projects. (click to enlarge) Source: Investor’s Meeting Presentation As natural gas production has significantly increased in the U.S., D is directing the major chunk of its capital expenditure to improve its natural gas infrastructure. As a matter of fact, one of the most important growth projects of the company is the Atlantic Coast Pipeline (NYSE: ACP ) project, which is a joint venture of D, Duke Energy (NYSE: DUK ), Piedmont Natural Gas Company (NYSE: PNY ) and AGL Resources Inc. (NYSE: GAS ). The ACP project’s pipelines, which have a capacity of 1.5Bcf/day, expandable to 2Bcf/Day, are waiting for FERC approval. The project’s construction is expected to begin in mid-2016, after which it will be made available for commercial operations by the end of 2018. D has the largest stake of 45% in the project, and I believe the company will benefit from this $5 billion project in the long run by meeting the increased natural gas transmission demand in Virginia and in North Carolina. Also, the company has invested $500 million towards its 1.0-1.5Bcf/day Supply Header Project (NYSE: SHP ). The timing to start SHP operations has been perfectly linked to the ACP project in order to support ACP by connecting its pipelines with five supply header reception points. With their operations scheduled to start in 2018, ACP and SHP will deliver natural gas to Virginia and North Carolina. In fact, these projects will allow D to increase its rates, which will portend well for its top and bottom-line growths in the long term. In addition to the ACP and SHP projects, the company has also agreed to acquire CGT for its subsidiary Dominion Midstream Partners, LP (NYSE: DM ). The addition of CGT offers an appealing opportunity to DM to raise rates in Virginia and Carolina, which will portend well to improve the company’s overall earnings base in the years ahead. Furthermore, the company is actively working to capitalize on the growth potentials of its Cove Point LNG export project, which has a capacity of 5.25 million tons/year . The Cove Point terminal facility is the first LNG export facility outside Louisiana and Texas to get government permission to export LNG. And it has created D’s monopoly, which will allow the company to enhance its bargaining power with suppliers. The company has already signed a 20-year LNG supply contract with Japan’s Sumitomo Corporation and Gail India. Owing to the longevity of these contracts, I believe D will have secure and strong top and bottom line bases for the years ahead. In addition to the abovementioned projects, the company is also making investments in renewable energy projects to strengthen its energy portfolio and comply with environmental regulations. In this regard, D has acquired the 28.4MW West Antelope Solar Park and the 50MW Pavant Solar Project . In its attempts to further capitalize on the growth prospects of renewable energy projects, the company has recently filed a request with VSCC to construct the first and largest solar facility in Virginia. By facilitating its customers to purchase electricity from its 2MW solar energy facility in Virginia, the company has created another important revenue generating source. Due to the impressive capital expenditure outlook and healthy growth prospects of the ongoing projects, I believe D is well-headed to delivering EPS growth in high-single digits. The company is scheduled for the 4Q’14 earnings call early next month, and during the earnings call, D will update its capital expenditure outlook and provide 2015 earnings guidance; any increase in capital expenditure outlook will portend well for its future growth and stock price. Hefty Dividends D’s healthy growth prospects have been fueling its earnings and cash flow growth, and helping it make attractive dividend payments to shareholders. Owing to its strong track record of making hefty dividend payments, the company is currently offering an attractive dividend yield of 3% . Since D is aggressively pursuing growth opportunities by making capital expenditures, I believe the company will attain more cash flow stability in the years ahead. Also, the company will continue to grow its dividends at a healthy pace in the years ahead; in the last five years, the company increased its dividends at an average rate of 7.3% . Risks The company’s efforts to expand its business operations, if not handled and executed effectively, could result in mismanagement and could weigh on its future performance. Moreover, regulatory restrictions and unfavorable movements in commodity prices are key risks to its future stock price performance. Conclusion The company’s ongoing efforts to extend and improve its operations are well-headed to grow its future top and bottom-line numbers. Moreover, the company’s healthy earnings growth prospects will support its cash flow base, which will allow it to consistently grow its dividends. The company currently has a higher forward P/E of 21.15x , as compared to Duke Energy’s and Southern’s forward P/E of 18.60x and 18.20x , respectively. I believe the higher forward P/E of D is justified due to its better growth prospects, as shown below in the table. Also, the company offers cheaper growth as compared to its peers, as it has a lower PEG of 2.9 , as compared to DUK’s PEG of 3.5 and SO’s PEG of 4.5 . The following table shows that D’s future earnings growth rate remains better than its peers. 2015 2016 2017 Long-Term 5-Year D 8.77% 4.80% 6.11% 6.05% DUK 3.97% 4.34% 5.27% 4.76% SO 2.13% 3.66% 4.31% 3.63% Source: Nasdaq.com
Federated Makes Case For Truly Active Management

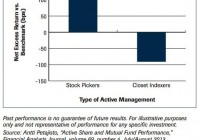
By DailyAlts Staff “It can pay to be active,” according to Federated Investment Consulting, whose recent whitepaper makes the case against passive indexing and for “truly active management.” Conceding that passive strategies can perform “as well as the average,” Federated argues that portfolios constructed with little regard to benchmarks can outperform, particularly during periods like the one we appear to be entering. Truly Active Management Actively managed funds seek to outperform their benchmarks, such as the S&P 500 for equity funds. Passively managed funds, by contrast, seek only to match the performance of the benchmark to which they’re indexed. Thus, in bear markets, passively managed funds tend to post wide losses, while actively managed funds have the flexibility to shift exposures to minimize losses or even eke out gains. According to Federated’s whitepaper , studies suggest “truly active management” can “generate the opportunity for outperformance” even after fees. These same studies show that “truly active management” tends to do better than passive management during periods of declining correlations across markets. For years, global central banks were “on the same page” coordinating monetary policy; but now the Federal Reserve is widely expected to begin raising interest rates in the U.S. sometime in 2015, while the Bank of Japan and European Central Bank are doing the opposite. This divergence of global policy is widely expected to result in the “declining correlations across markets” under which “truly active management” tends to outperform. But what is “truly active management?” Federated defines it simply as strategies “that construct portfolios with little regard to their benchmark,” in which security selection and weighting “deviates significantly” from the benchmark. These are “stock picking” strategies, and Federated believes “the virtues of stock picking may rise” since the U.S. stock market is near record highs and “the prospect for higher rates is threatening the outlook for bonds.” Federated also references a study conducted by Antti Petajisto and Martijn Cremers of the Yale School of Management that shows that funds with higher levels of active management outperform those that are considered “benchmark huggers,” as seen in the following chart: Historical Evidence Federated uses historical evidence in support of its thesis. The period of 2010-2011 saw increasing correlation, high volatility, and “low dispersion between the highest individual stock return and the lowest individual stock return.” These conditions naturally favor passive managers. But in 2012 and 2013, correlations fell and dispersion rose, creating the conditions under which active managers can more easily outperform. Passive strategies generated returns of roughly 16% and 32% in 2012 and 2013, but the returns of actively managed strategies were even higher. The top 25% of active managers have significantly outperformed passive strategies dating back to 1999. A $10,000 investment in a top quartile active manager made on December 31, 1998 would have grown to $35,411 by year-end 2013, while the same investment in the S&P 500 would have grown to just $19,854, according to Federated. This significant outperformance among the top 25% is a strong argument for investors to conduct thorough due diligence on prospective active managers. Conclusion “Active management has its issues,” Federated concedes near the end of the whitepaper, and chief among them are fees. But at the same time, Federated says “fees are relative,” and that low-fee options make sense for “highly efficient asset classes,” but not asset classes such as “international growth and value stocks, and small-cap core and value stocks,” which are “highly inefficient.” Management fees are justified since passive indexing to “highly inefficient” asset classes will result in relative underperformance, in Federated’s view. Most investors want to beat the average, and the only way to do that is through active management. Low-fee passive indexing inevitably results in average returns, minus a low fee. But active management, even with higher fees, can result in returns that greatly exceed the average, thereby resulting in market-beating returns – even after fees.

Does ‘Sharpe Parity’ Work Better Than ‘Risk Parity?’

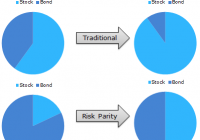
By Wesley R. Gray Strategies employing Risk Parity have been favored by mutual funds and other market participants the past few years. The attraction of risk parity strategies is the great story associated with the approach and the historical performance over the past 30 years has been favorable. However, there is an argument that historical risk parity performance has been driven by leveraged exposure to Treasury Bonds, which have been on an epic tear the past ~30 years. Nonetheless, good stories such as risk parity never die on Wall Street, they merely adapt and overcome. This white paper by UBS highlights skepticism around risk parity and presents a different, but related asset allocation method: Sharpe Parity. Risk Parity Background: As you may recall, risk parity identifies weights that equalize “risk” across asset classes. Let’s first review a simple risk parity example. Here is a visual interpretation of how risk parity works. If we allocate to a 60/40 stock/bond portfolio on a dollar-weighted basis, on a risk-contribution basis, we might be getting 90% of our risk from stocks and 10% of our risk from bonds. Risk parity comes to the so-called rescue. Risk parity suggests that we rejigger the dollar-weighted 60/40 portfolio in such a way that the risk contributions end up being 50% driven by bond exposure and 50% driven by stock exposure. In other words, our “risk contributions” are at parity, hence the title “risk parity.” How does this work in practice using the most basic version of risk parity outlined in the Asness, Frazzini, and Pedersen paper: (click to enlarge) Source: Leverage Aversion and Risk Parity (2012), Financial Analysts Journal, 68(1), 47-59 But UBS Doesn’t like Risk Parity. Why? As per their own research: Risk Parity ignores return and focuses only on risk; Risk Parity uses volatility as the sole measure of risk, while neglecting other credit-related risks, such as default risk and illiquidity; Risk Parity encounters huge drawdowns if bonds and equity sell off together; A low nominal return world makes recovery from risk parity drawdowns difficult. UBS proposes a new asset allocation strategy, which shares some concepts with risk parity, but in their approach risk parity’s “standard deviation” is replaced with an estimate for an asset’s Sharpe Ratio. Here’s an explanation of the concept: “Think about it this way: if asset X has a Sharpe ratio of 2 it means that we have two units of return for 1 unit of risk, while asset Y with a Sharpe ratio of 1 gives us only 1 unit of return for the same amount of risk. In that case we construct a portfolio with the weight for asset X being double the weight of asset Y.” Strategy Background: This approach makes some sense, as it seems to account for return as well as risk. This approach is also in line with modern portfolio concepts such as mean-variance analysis, where investors want to maximize marginal Sharpe Ratios to create the so-called “tangency portfolio” that all MBA 101 students know and love. But how does “Sharpe Parity” stand up to empirical scrutiny? In order to address this question, we compare 4 asset allocation approaches: Equal-weight allocation , an equal-weight allocation with a Simple Moving Average rule , simple Risk Parity , and Sharpe Ratio Parity . Equal-weight (EW_Index): monthly rebalanced equal-weight portfolios. Simple Moving Average (EW_Index_MA): calculate a simple moving average each month (12 month average); if the MA rule is triggered (when the current price > 12 month moving average), buy risk, or else, allocate to the risk-free asset. Risk Parity: follow the simple risk parity algorithm; use a look-back period of 36 months for the “standard” risk parity model. Sharpe Parity: use a look-back period of 36 months for the Sharpe Parity model; if an asset has a negative Sharpe Ratio, this asset’s weight will be 0; note that if all the assets’ Sharpe Ratios are negative, the strategy will allocate 100% to the risk-free asset. Data Description: To test these 4 strategies, we apply them to the “IVY 5” asset classes: SP500 = SP500 Total Return Index EAFE = MSCI EAFE Total Return Index REIT = FTSE NAREIT All Equity REITS Total Return Index GSCI = GSCI Index LTR = Merrill Lynch 7-10 year Government Bond Index (click to enlarge) The “IVY 5” Concept. Click to enlarge. Our simulated historical performance period is from 1/1/1980 to 7/31/2014. Results are gross, and thus do not include the effects of fees. All returns are total returns and include the reinvestment of distributions (e.g., dividends). Data was obtained via Bloomberg. Indexes are unmanaged, do not reflect management or trading fees, and one cannot invest directly in an index. Please see the disclosures at the end of this document for additional information. Sharpe Parity has a slightly higher CAGR. However on a risk-adjusted basis, Equal Weight MA and Risk Parity outperform the Sharpe Parity system, as reflected in their higher sharpe and sortino ratios. The simple moving average technique has the lowest drawdown and the best overall risk-adjusted performance. (click to enlarge) The results are hypothetical results and are NOT an indicator of future results and do NOT represent returns that any investor actually attained. Please see disclosures for additional information. Additional information regarding the construction of these results is available upon request. Does Lookback period matter? Next, we change the look-back period from 36 months to 3 months, which is identical to the lookback period used in the UBS whitepaper. Here’s the result: Sharpe Parity based on a 3 months lookback period has larger CAGR, but also has larger drawdowns, on a monthly, worst case, and cumulative basis. Sharpe and sortino ratios are worse than the 36 month lookback version. (click to enlarge) The results are hypothetical results and are NOT an indicator of future results and do NOT represent returns that any investor actually attained. Please see disclosures for additional information. Additional information regarding the construction of these results is available upon request. Conclusions Based on these results, it seems hard to conclude that Sharpe Parity, particularly with a 3 month look-back period, offers a clear-cut advantage over traditional Risk Parity approaches. In fact, on a risk-adjusted basis, it compares poorly. Based on this analysis, it would appear that simple equal-weight portfolios with trend-following rules have worked better than more complicated risk parity or sharpe parity systems. Original Post