Tag Archives: author

Inside HACK: The Sought-After Cyber Security ETF

The cyber security industry has gained immense popularity in recent years and is the fastest-growing corner of the broad technology space. This is because cyber-attacks on enterprises and government agencies are widespread with growing Internet usage, raising the need for more stringent cyber security from hackers. Hacking has become more sophisticated, dangerous and harder for companies (and even governments) to stop. According to the report from the Global State of Information Security Survey 2015, cyber attacks across the globe have risen about 66% over the past five years and 48% from 2013. Some of the well-known companies in the recent spate of data breaches include Target (NYSE: TGT ), eBay (NASDAQ: EBAY ), Home Depot (NYSE: HD ), AT&T (NYSE: T ) and JPMorgan Chase (NYSE: JPM ). The situation will likely to worsen in 2015, as hackers will continue to adopt advanced techniques and strategies to infiltrate networks hiding their tracks. Solid Long-Term Prospects As per McAfee, cyber-warfare and espionage attacks are expected to increase in frequency. Attacks on Internet of Things (IoT) devices will rise rapidly due to whopping growth in the number of connected objects, poor security and the high value of data on IoT devices. And new mobile technologies will allow more mobile attacks. Growing awareness for the protection against these cyber threats will continue to propel demand for spending on information security. According to Gartner, global security spending will increase to $76.9 billion in 2015 from the expected $71.1 billion in 2014. Most of the growth will likely come from the rapid adoption of mobile, cloud, social and information technologies. Another data from ABI research showed that global cyber-security spending would reach $109 billion by 2020. Investors could easily tap the cyber-security spending boom and rising demand in a basket form. Investors should note that there is currently one ETF – PureFunds ISE Cyber Security ETF (NYSEARCA: HACK ) – which offers exposure to those companies that ensure the safety of computer hardware, software, networks and fight against any sort of cyber malpractices. The fund provides a good opportunity for investors to play the niche area of cyber security. This is especially true as it has been getting the first-mover advantage and has accumulated $157 million in AUM in just two months of debut while surging 3.6% in the same period. Average daily volume is solid as it exchanges nearly 227,000 shares in hand. Given this, it might be worth it to shed some light on this ETF and its holdings for those who are unfamiliar with the product, but are thinking about jumping in on the space. Below, we highlight some of the key details regarding HACK, which made it one of the fastest-growing and most successful ETFs of last year. HACK in Focus The ETF tracks the ISE Cyber Security Index, holding 30 securities in its basket. It is well spread out across components as each security holds no more than 5.01% of total assets. Ahnlab, Infoblox (NYSE: BLOX ), and Fireeye (NASDAQ: FEYE ) occupy the top three positions in the basket. From an industrial look, software and programming accounts for nearly two-thirds of the portfolio while communication equipment and Internet mobile applications round off the top three with a double-digit allocation each. In terms of country exposure, U.S. firms take the top spot at 72%, followed by Israel (12%), the Netherlands (5%), South Korea (5%), Japan (4%), Finland (2%) and Canada (1%).
How Does VXX’s Daily Roll Work?

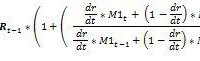
All volatility Exchange Traded Products (ETPs) use indexes that track a mix of two or more months of the CBOE’s VIX Futures. Calculating this mix is not trivial and has resulted in a lot of bleary eyes – including my own. My intent with this post is to help you understand, and if you desire, accurately compute the key indexes used in the iPath S&P 500 VIX Short-Term Futures ETN (NYSEARCA: VXX ) and other short-term volatility funds using Excel or similar tools. Why do we need a roll anyway? If we could directly buy the CBOE’s VIX index none of this would be necessary. Unfortunately, no one has figured out a cost effective approach so we are forced to use the next best thing – VIX Futures. Like options, VIX futures have fixed expiration dates so volatility indexes need a process of rotating their inventory of futures in order to have consistent exposure to volatility. This rotation process is evident in the open interest chart below – the next to expire futures being closed out and the next month of futures being opened. Indexes and Funds are different things Before we dive into the details of how this rotation is dealt with, I’d like to address one source of confusion. ETPs are not obligated to follow the approach detailed in the indexes. They are allowed to use other approaches (e.g., over-the-counter swaps) in their efforts to track their indexes. When ETPs are working properly, their prices closely track the index they specify in their prospectus minus their fees that are deducted on a daily basis. Because indexes are theoretical constructs they can ignore some practical realities. For example, they implicitly assume fractional VIX futures contracts exist and that the next day’s position can be put in place at market close – even though calculating that position requires market close information. I’m sure these issues cause headaches for the fund managers, but to their credit the funds usually closely track their index. The Index Calculation The details for the index (ticker SPVXSTR ) that VXX tracks are detailed in VXX’s prospectus , pages PS-21 through PS-22. The math is general enough that it covers both the short term index that VXX uses and the midterm index VXZ uses – which adds to its complexity. The equations use Sigma (?) notation, which probably makes it challenging for people that haven’t studied college level mathematics. I will present the math below using high school level algebra. Except for interest calculations all references to days are trading days, excluding market holidays and weekends. The volatility indexes used by short-term volatility ETPs ( list of all USA volatility ETPs ) utilize the same roll algorithm – at the end of each trading day they systematically reduce the portion of the overall portfolio allocated to the nearest to expiration contracts (which I call M1) and increase the number of the next month’s contracts (M2). The mix percentages are set by the number of trading days remaining on the M1 contract and the total number of days it’s the next to expire contract (varies between 16 and 25 days). So if there are 10 days before expiration of the M1 contract out of a total of 21 the mix ratio for M1 will be 10/21 and 11/21 for M2. At close on the Tuesday before the Wednesday morning M1 expiration there’s no mix because 100% of the portfolio is invested in M2 contracts. It’s important to understand that the mix is managed as a portfolio dollar value, not by the number of futures contracts. For example, assume the value at market close of a VIX futures portfolio was $2,020,000, and it was composed of 75 M1 contracts valued at 12 and 80 M2 contracts at 14 (VIX futures contracts have a notional value of $1K times the trading value). To shift that portfolio to a 9/21 mix for M1 and 12/21 for M2 you should take the entire value of the portfolio and multiply it by 9/21 to get the new dollar allocation for M1, $865,714 (72.14 contracts) and 12/21 times the entire portfolio value to get the dollar allocation for M2, $1,154,286 (82.45 contracts). Value weighting gives the index a consistent volatility horizon (e.g., 30 calendar days) – otherwise higher valued futures would be disproportionately weighted. The next section is for people that want to compute the index themselves. Yes, there are people that do that. If you are interested in the supposed “buy high, sell low” theory of roll loss you should check out the “Contango Losses” topic at the bottom of this post. The Variables Lower case “t” stands for the current trading day, “t-1” stands for the previous trading day. The index level for today (IndexTR t ) is equal to yesterday’s index (IndexTR t-1 ) multiplied by a one plus a complex ratio plus the Treasury Bill Return TBR t. The index creators arbitrarily set the starting value of the index to be 100,000 on December 20th, 2005. The number of trading days remaining on the M1 contract is designated by “dr” and the total number of trading days on the M1 contract is “dt.” M1 and M2 are the daily mark-to market settlement values, not the close values of the VIX futures. The CBOE provides historical data on VIX futures back to 2004 here . The Equations When dr is not equal to dt: When dr = dt (the day the previous M1 expires): Yes, this equation could be simplified, but then it wouldn’t fit as nicely into the equation below which uses a little logic to combine both cases: The equation assumes that the entire index value is invested in treasury bills. Contango Losses An interesting special case occurs when you assume that the M1 and M2 prices are completely stable and in a contango term structure for multiple days-for example, M1 at 17 and M2 at 18. In that situation the equation simplifies to: This special case illustrates that there is no erosion of the index value just because it’s selling lower price futures and buying higher priced futures-in fact it goes up because of T-bill interest. It’s the equivalent of exchanging two nickels for a dime-no money is lost. For more on this see: The Cost of Contango-It’s Not the Daily Roll . Disclosure: None

Don’t Rely On Your Emotions To Trade The Oil Patch

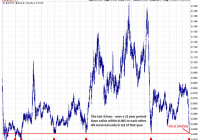
An inflection point has been reached in oil’s valuation per barrel. The Oil/Gold ratio at this level has historically confirmed a trend change. The supply/demand news cycle is beginning to turn. (The Oil/Gold Ratio: click to enlarge) The first thing one sees in the chart (above) is an almost perfect symmetry, with each low point occurring early in Q1 on the red line (excepting 1986, 88, 89). It begs a question for the curious: Under what previous economic conditions did the oil/gold ratio reach today’s extremes? What is the correlation in barrels per oz. of gold?” “How far into this drop are we currently?” We are at Financial Crisis lows (2008-09); and the deep devaluations of the late-1980s are the only levels remaining to be pierced. The oil/gold ratio has been at this level three times in the last two decades, and each time it rallied. The current comparison clocks in at $45/bbl. How cheap is oil? Early this morning you could buy 28 barrels of oil with a single oz. of gold, the most in the modern era (excepting 1988). I am using the price of gold to value a barrel of crude because gold is a storage of value. Oil is a cultural commodity and the substrate of modern industrial society. In terms of financial comparisons, gold retains its value, oil we use ubiquitously. The ratio measures the cost of that use. Observe the parabolic surges in the chart below. Excepting the go-go years of impossibly cheap oil (1986 and 1989), each one of these telephone-pole tops flamed-out quickly. (click to enlarge) If zoomed-in for a closer look (below), you can see that the final weeks of the surge (red boxes) were composed of unsustainable, soaring price-gaps. For example, an ounce of gold this morning could buy you 33% more oil than on January 1, 2015, less than 3 weeks ago; or 60% more oil than in November, 2014! Is this any way to price a commodity that’s used 91ML bbl a day? In just the last week we have had several 5% up and down days close-by in sequence, resulting in single-session half-trillion dollar gains or losses for crude oil. This kind of price discovery only occurs near turning-points – when the market can’t figure out what something is worth – when all the news and analysis is clouded in total confusion – and hence the focus of this article. For ages, if you wanted to figure out what something was worth, you compared it to gold; and at this point, oil is as cheap as it gets. (click to enlarge) In my previous articles, I have used a pressure-cooker model to scale into positions through dollar-cost averaging, buying at gradual intervals over a few weeks time. This method sometimes takes weeks, even months, to fulfill, but in the end it works, because every tick down lowers the cost-basis before the eventual turn. The important thing is to begin near the extremes. Crude oil is selling for less than it takes to drill, ship and deliver it almost anywhere in the world. Some OPEC countries could actually default on their debts if crude oil remains in this state of devaluation. But there is hope on the horizon. An upcoming storm of lay-offs, falling rig counts, and production cuts is beginning to slash into the North American crude suppliers (the source of oversupply), and by 2Q’2015 this pullback should be in full swing. SA author Wolf Richter fully describes this retrenchment in his fiery articles . The trade here is to gradually buy into a crude oil ETF, for example, XLE , OIL , or USO , and hold until oil hits $70/bbl. For the more speculative investor, the leveraged ETFs – UCO (2x crude), or UWTI (3x crude) are also an option.