Tag Archives: author

Do The Changes In Supply For Silver Impact SLV?

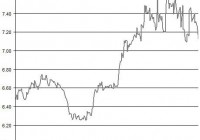
Summary The price of SLV remained flat in the past several weeks. Let’s examine the changes in the supply for silver and its relation to SLV. The recent news from Greece could also play in favor of SLV. The recovery of the iShares Silver Trust ETF (NYSEARCA: SLV ) came to a halt in recent weeks as its price remained around $16 during most of February. Do the expected changes in the supply for silver likely to impact the price of SLV in the near term? Also, how do the latest market developments play out for SLV? Even though the SPDR Gold Trust ETF (NYSEARCA: GLD ) has outperformed SLV during the past year, the ratio between the two remained in the 7.2-7.6 range in recent weeks. The relation between the two tends to be strong and positive. Source of data: Google Finance If the price of GLD were to resume its rally, this could also start to push back up SLV. Besides the changes in the demand for silver and gold for investment purposes, let’s review the expected changes in the supply for silver. Does silver supply matter? One issue that continues to resurface is around the changes on the supply side of silver. In the past few years, the silver production has picked up. In 2012 , production reached 792 million oz; in 2013, output was 819.6 million oz; and for last year , current estimates for the silver production were around 868 million oz – nearly 6% gain year over year. This year, however, HSBC (NYSE: HSBC ) projects silver production to slip to 850 million oz, which represents a 2% fall compared to 2014. After all, some silver producers such as Pan American Silver (NASDAQ: PAAS ) have higher all-in sustaining costs than the price of silver. This is likely to force such companies to slow down their production or, at the very least, slash capex for future growth. Further, silver scrap, which accounted for nearly 16% of total supply back in 2013, is also expected to come down in 2015 compared to the previous year. Will these developments be enough to push back up the price of SLV? As I pointed out in the past, the changes in the physical world of silver have a secondary role in the actual price of SLV. Don’t get me wrong. The sudden drop in supply of silver could push up SLV prices. But the big mover for SLV will remain the changes in the demand on paper for silver. Since silver has industrial use and also investment use, a drop in supply of silver doesn’t have a strong impact on the latter, only the former. If changes in physical demand and supply of silver had a strong impact on SLV prices, then we should have seen a much better match between the changes in supply/demand and prices. Case in point, back in 2012, the physical demand for silver was 954.4 million oz – this was well below the supply for silver. Then in 2013, the physical demand was higher than the supply. But silver prices only came down in 2013 compared to 2012. Moreover, it’s hard to consider the changes in supply/demand for silver as the driving force behind the price of SLV back in 2008-2011 when in fact the global economy only cooled down the demand for silver for industrial fabrication. Looking forward, the World Bank still expects the price of silver to remain around $18 in the coming years. But this outlook could change especially if the U.S. dollar resumes its rally and if the interest rates in the U.S. pick up again. The upcoming release of the minutes of the FOMC meeting from last month may provide some additional insight behind the latest meeting and shed some light on the FOMC’s next move vis-à-vis its rate hike. The recent economic reports in the U.S. were mostly positive, including the non-farm payroll and JOLTS reports. They have increased the odds the market gives for the FOMC to raise rates in the middle of the year. Also, the U.S. dollar didn’t do much in recent weeks against the yen. The linear correlation between SLV and U.S. dollar/yen was mid-strong at -0.51 during the past month. Source of data: Bloomberg If the U.S. dollar were to resume its rally, this could have a negative impact on the price of SLV, or at the very least curb down the rise in SLV. The Greek debt The ongoing debt problems of Greece could still play in favor of precious metals, including SLV. It’s unclear when the Greeks will run out of money, but it’s not going to last long (some estimated it could be as soon as March ). Despite the little progress achieved last week in the Euro group meetings, a possibility of a Greek exit remain low, for now. This week, the second round of Euro group meetings will take place. Greece will look toward a reduction in debt, extend debt maturities and a lower fiscal surplus than the 4.5% mandated from next year. The state elections in Hamburg , Germany, ended and now that they are behind Merkel, the Germans might be more open to reach a compromise with Greece. But as long as the uncertainty in the markets remains high and a possible Greek exit is still in a possibility, the demand for investments such as SLV is likely to rise. The expected fall in the supply for silver is likely to have a minor role in the progress of SLV. The changes in demand for silver for investment purposes will remain the main driving force behind SLV. For now, the uncertainty in Europe could play in favor of SLV. But if the U.S. dollar were to start rising again, and if the interest rates in the U.S. also pick up, these factors could push back down SLV. For more see: Will Higher Physical Demand for Silver Drive Up SLV? Disclosure: The author has no positions in any stocks mentioned, and no plans to initiate any positions within the next 72 hours. (More…) The author wrote this article themselves, and it expresses their own opinions. The author is not receiving compensation for it (other than from Seeking Alpha). The author has no business relationship with any company whose stock is mentioned in this article.

Calpine Corp.: A Different Kind Of Utility

Summary Operates diversified, modern natural gas-fired power plants. Company pays no dividend yield, only share repurchases. Management exercises prudent control of debt and input costs. Calpine Corp. (NYSE: CPN ) has a portfolio (including partnership interest) of over 88 power plants generating in excess of 26,000 megawatts of power in North America, primarily in California, Texas, and the Eastern seaboard. As an added benefit, these are modern, clean energy plants using natural gas and geothermal to produce power, resulting in lower carbon emissions – 95% of the company’s power generation was done with natural gas. This marks it as an industry leader going forward as natural gas is expected to be a leading generator of power in the United States in the coming years, as coal continues its decline and natural gas is discovered in shale plays. While the company consumed 793 billion cubic feet of natural gas in 2014 (10% of all natural gas used for power generation), the EIA estimates the US has over 350 trillion cubic feet of proven natural gas reserves at the end of 2013. Prior Bankruptcy, Current Cost Control In 2005, Calpine filed for bankruptcy protection in one of the largest bankruptcies in US history as natural gas prices had soared, a new glut of competing power plants came online, and the company’s debt load of $22B became unmanageable due to poor structure. Calpine’s prior leadership team was poor and mismanaged the company in its debt and hedging practices. The company emerged from bankruptcy to begin trading again in 2008. I think it is important to note that the market today is much different than it was then – Calpine’s current outstanding debt is half of what it was, has been financed at lower interest rates, and the natural gas market has fundamentally changed. (click to enlarge) As noted, the company has done a great job in recent years of paying down and refinancing debt. Total interest expense has fallen from $813M in 2010 to $645M in 2014, a decrease of 20%, as total revenue has grown 22% in that same time frame. Long-Term Outlook, Coal to Gas Switching Depending on the fluctuating spot prices of coal and natural gas, power plants using one or the other frequently set the price of wholesale energy. Most often in the past decade, but as natural gas prices have fallen it has become more commonplace that natural gas sets the price. When this switching occurs, demand and total generation volumes increase for Calpine. If you look back to 2012 when this occurred often, you’ll find elevated levels of operating income. Forward markets for natural gas prices suggest this may happen again in 2015. Fundamentally, in the intermediate/long term, coal to gas switching may become even more prevalent as environmental regulations and political pressures force coal-fired power generation to reduce levels of pollutants like sulfur dioxide and nitrogen monoxide through expensive retrofits. Costs will increase for these market participants and natural gas power plants may overtake coal as the primary form of energy generation in the United States. Wait, No Dividend? Utilities are known for and sought out by income investors for the income that their dividend payouts provide. Retail investors frequently screen stocks by dividend yield and history to choose stocks. CPN does not pay one – but not for lack of profitability or cash flow. Thad Hill, CEO, stated in the Q4 2014 Earnings Release , 2014 wrapped up in a fine year for Calpine, we are proud to report adjusted EBITDA of $1.949 billion, adjusted free cash flow of $830 million and adjusted free cash flow per share of $2.03. So what gives? CPN provides returns to shareholders in the form of share buybacks solely. Thad Hill further states, Finally, we have continued to return money to our shareholders by completing $277 million of buyback since the last quarterly call in November. As our stock price moved down with the recent commodity price sell off, we took advantage of it and stepped up our share repurchase program. Since beginning the program in 2011, we have repurchased approximately 25% of our outstanding shares for $2.4 billion. $1.1B of those share repurchases have been done in the last year. Operating using a model of only share repurchases gives management added flexibility in deploying capital. Who better to know when the shares are undervalued than management? Or when that capital may best be used to fund a timely acquisition that has a greater expected NPV than through shareholder returns? Ownership/Short Interest CPN also has high institutional ownership (95%). This ratio is one of the highest I could find among utilities – only El Paso Electric (NYSE: EE ) and ITC Holdings (NYSE: ITC ) have higher rates, at 98.9% and 95.1%, respectively. Institutional ownership here is key – considering the vast amount of resources, talent, and research that these institutions provide their researchers, their investment decisions generally carry great weight with retail investors. In this case, retail investors have not followed, most likely due to the earlier highlighted issues of the lack of a dividend and prior bankruptcy. Analysts have a similar opinion to institutions. 75% of analysts rate the stock a strong buy/buy, with none rating it as underperform/sell. The average target price is $25.00 – nearly 20% upside from current prices. *Sourced from Yahoo! Finance Short interest in CPN (4% shares held short) is within the top quintile of utilities. Its short interest is similar to utilities that have no free cash flow or those with higher P/E ratios and lower growth prospects. Having no dividend is a double edged sword – no short wants to get stuck covering a dividend over ex-date, so short interest in the sector is usually mild even when the sector trades overvalued. The company’s lack of a dividend yield gives shorts the advantage of not being forced to cover at high prices before ex-date or feeling the sting of that negative dividend payment hit their account. 2015 Guidance (click to enlarge) The company guides $2.10-$2.60 a share in free cash flow/share – 3.5% increase over 2014 on the low end and 28% on the high end. This is forecast to be a record year in cash flow availability for the company, with plenty of available cash for repurchases and acquisitions. As of the February earnings release, the company had already repurchased $125M in shares in 2015 – on pace for another year of over $1B in repurchases – which would retire 12% of the float at the current share price. As the current share price sits below the average share price of repurchases in 2014, so I expect these buybacks to continue as management continues to believe current prices are an excellent investment opportunity. Conclusion A purchase in Calpine is a purchase of a company with a historical stigma and no steady income stream to shareholders. But it is also a purchase in a company that analysts and institutions have committed big to and one that is set to benefit strongly from a coming shift in energy production from coal to natural gas on the heels of the American resurgence of power in oil and natural gas production. I see fair value today at $26.00/share – more than 20% upside from current prices. Disclosure: The author is long CPN. (More…) The author wrote this article themselves, and it expresses their own opinions. The author is not receiving compensation for it (other than from Seeking Alpha). The author has no business relationship with any company whose stock is mentioned in this article.

2014 Diversified ETF Portfolio: Annual Performance, Replacing BOND With TLT And 2015 Estimates

Summary The S&P 500 had another great year with 14% annual return (including dividends). The diversified portfolio only returned 3.6%, held back by Business Development Company ETF. Portfolio yield exceeded the S&P 500 by 118 basis points. Pimco’s BOND ETF was replaced by TLT. TLT chosen based on correlation. S&P 500 Fundamentals need to continue to grow to have a positive 2015 year. Here are the fourth quarter and full-year results of a diversified ETF portfolio. The holding in BOND was replaced with TLT because of a change in my thesis. BOND was included to cover the bond portion of the portfolio because my thesis was that the expertise of Bill Gross would help BOND perform during calendar year 2014. Once Bill Gross quit Pimco, it was time for a change. Q1 Update: Link Q2 Update: Link Q3 Update: Link MARKET PERFORMANCE The S&P 500, as measured by the Vanguard S&P 500 ETF (NYSEARCA: VOO ), was up 13.97% (including dividends) for CY2014. Not too shabby. (click to enlarge) Eight of the nine sectors were positive for the year. Energy was the one sector that was negative. Technology, health, and utilities all outperformed the S&P 500. The utilities sector was the best performer, up 24.4%, which is usually considered a safe harbor investment. According to my calculations, a portfolio equal weighted in each sector would have returned 11% for the year. Throughout CY2014, bond yields fell. Yields closed the year at 2.2%. There was a significant drop during Q4, which is reflected in the performance of TLT. A drop in yields results in a price increase for the bonds. PORTFOLIO PERFORMANCE For Q4, the portfolio was up 2% while the S&P 500 was up 4.89%. For the year, the portfolio was up 3.62% while the S&P 500 was up 13.97%. PowerShares Buyback Achievers (NYSEARCA: PKW ), PowerShares Fundamental Pure Small Value (NYSEARCA: PXSV ), and the iShares 20+ Year Treasury Bond ETF (NYSEARCA: TLT ) all outperformed the S&P 500 for the quarter. Market Vectors BDC Income ETF (NYSEARCA: BIZD ), Vanguard FTSE Emerging Markets ETF (NYSEARCA: VWO ), and SPDR Barclays High Yield Bond (NYSEARCA: JNK ) all posted negative returns for the quarter. (click to enlarge) For the year, only the Market Vectors BDC Income ETF was down; even with its high dividend yield, it was not able to generate a positive return. No one fund outperformed the S&P 500 for the year. The Buyback Achievers came close and the Small Value fund posted a decent rally at year’s end, along with the Bond ETF. (click to enlarge) Here is the performance of the portfolio for the year: BOND FUND REPLACEMENT Why did I replace PIMCO Total Return ETF with iShares 20+ Year Treasury Bond ETF? The purpose of the bond fund is to give some negative correlation to the portfolio and help smooth out some returns over a long time frame (I know, I am monitoring the portfolio on a quarterly basis). As soon as it was announced that Bill Gross was leaving Pimco, I ran a correlation matrix on several possible bond funds. I used the following funds: iShares TIPS Bond (NYSEARCA: TIP ) Vanguard Short-Term Infl-Prot Secs ETF (NASDAQ: VTIP ) iShares Core Total U.S. Bond Market ETF (NYSEARCA: AGG ) Vanguard Intermediate-Term Corp Bd ETF (NASDAQ: VCIT ) SPDR Barclays Capital Convertible Bond ETF (NYSEARCA: CWB ) iShares 20+ Year Treasury Bond Vanguard Short-Term Corporate Bond ETF (NASDAQ: VCSH ) Vanguard Long-Term Corporate Bond ETF (NASDAQ: VCLT ) Here are the results of the correlation matrix (as of 3-Oct-2014): (click to enlarge) TLT has the largest negative correlation to the three equity funds (PKW, BIZD, and PXSV) and therefore, I choose it as the replacement for BOND. Note: The ETF share price used for the correlation matrix was sourced from Yahoo! Finance. TIP came in a very close second. As an exercise, I took the 10 worst days for PXSV (01-Jan-2014 through 03-Oct-2014) and compared that with TLT and TIP. TIP actually had the least correlation over this time frame. LOOKING FORWARD Last year at this time, I estimated a 10% return for the S&P 500. The S&P 500 outpaced that estimate. I estimated a 4.5% increase in sales per share with an 8.5% EPS margin. The actual sales per share increase was only 3.5%, but the EPS margin was 9.18%, which resulted in an actual EPS of $105.96, as compared with my $99.07 EPS estimate. I estimated a 20.5 multiple but the multiple (for the trailing twelve months) came in at 19.4, still allowing a greater than 10% return for the S&P 500. How about for 2015? I looked at three scenarios below. With the continuing improving employment numbers and the recent robust GDP numbers, I would expect the S&P to return between 2.5% and about 14% for the year. Large range, I know. Looking at the three scenarios below, it does not take much degradation in the fundamentals to get a negative return for the year. I was surprised how easy it would be to get a -11% annual return, using what I would still consider to be some decent fundamental performance. (click to enlarge) Disclosure: The author is long VOO, VWO. (More…) The author wrote this article themselves, and it expresses their own opinions. The author is not receiving compensation for it (other than from Seeking Alpha). The author has no business relationship with any company whose stock is mentioned in this article.