Tag Archives: alternative

Investing For Retirement Using American Century Mutual Funds
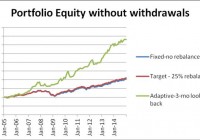
Summary American Century offers a set of diversified mutual funds which can be successfully used for construction of investment portfolios with good withdrawal rates. A set of just three mutual funds, a bond, an equity growth, plus an equity value fund generates good returns with relatively low risk. From January 2005 to December 2014, an American Century portfolio with fixed allocation could produce a safe 5% annual withdrawal rate and 2.15% annual increase of the capital. Same portfolio with rebalancing at 25% deviation from the target allowed a safe 5% annual withdrawal rate and achieved 2.21% compound annual increase of the capital. Same portfolio with momentum-based adaptive allocation could have produced a safe 12% annual withdrawal rate and 3.51% annual increase of the capital. This article belongs to a series of articles dedicated for investing in various mutual fund families. In previous articles we reported our research on Fidelity , Vanguard , and T Rowe Price mutual fund families. The current article does the same for American Century family of mutual funds. The series of these articles is aimed at a broad spectrum of investors. They may be useful to small individual investors as well as to any large institution managing retirement accounts. We report the performance of the portfolios under two scenarios: (1) no withdrawals are made during the time interval of the study, and (2) withdrawals at a fixed rate of the initial investment are made periodically. Since this is the fourth family of mutual funds for which we are building an investment portfolio for retirement, we elaborate here upon the general methodology we use. The set of funds selected for building the portfolio should satisfy the following criteria: (1) It should include at least one bond fund. (2) It should include a few equity funds, generally between two to five. Those funds should have enough similarity and diversity. As an example, we may select one value and one growth fund. (3) Historically, the funds selected should have performed better than most other funds in their category. Applying these principles, we selected three mutual funds for inclusion in a portfolio of American Century mutual funds. They are the following: American Century Government bond fund (MUTF: CPTNX ) American Century Heritage fund (MUTF: TWHIX ) American Century Value fund (MUTF: TWVLX ) As in the previous articles, three different strategies are considered: (1) Fixed asset allocation. The portfolio is initially invested 50% in the bond fund and 50% equally divided between the two stock funds, without rebalancing. (2) Target asset allocation with rebalancing. The portfolio is initially invested 50% in the bond fund and 50% equally divided between the two stock funds and is rebalanced when the allocation to any fund deviates by 25% from its target. (3) Momentum-based adaptive asset allocation. The portfolio is at all times invested 100% in only one fund. The switching, if necessary, is done monthly at closing of the last trading day of the month. All money is invested in the fund with the highest return over the previous 3 months. The data for the study were downloaded from Yahoo Finance on the Historical Prices menu for three tickers: CPTNX, TWHIX, and TWVLX. We use the monthly price data from January 2005 to December 2014, adjusted for dividend payments. The paper is made up of two parts. In part I, we examine the performance of portfolios without any income withdrawal. In part II, we examine the performance of portfolios when income is extracted periodically from the accounts. Part I: Portfolios without withdrawals In table 1 we show the results of the portfolios managed for 10 years, from January 2005 to December 2014. Table 1. Portfolios without withdrawals 2005 – 2014. Strategy Total increase% CAGR% Number trades MaxDD% Fixed-no rebalance 103.55 7.30 0 -24.61 Target-25% rebalance 109.82 7.63 4 -22.03 Momentum-Adaptive 330.90 15.73 35 -13.97 The time evolution of the equity in the portfolios is shown in Figure 1. (click to enlarge) Figure 1. Equities of portfolios without withdrawals. Source: This chart is based on EXCEL calculations using the adjusted monthly closing share prices of securities. From figure 1 it is apparent that the rate of increase of the adaptive portfolio is substantially greater than the rate of the fixed and target allocation portfolios. Part II: Portfolios with withdrawals Assume that we invest $1,000,000 for income in retirement. We plan to withdraw monthly a fixed percentage of the initial investment. That amount is increased by 2% annually in order to account for inflation. In table 2 we show the results of the portfolios managed for 10 years, from January 2005 to December 2014. Money was withdrawn monthly at a 5% annual rate of the initial investment plus a 2% inflation adjustment. Over the 10 years from January 2005 to December 2014, a total of $535,920 was withdrawn. Table 2. Portfolios with 5% annual withdrawal rate 2005 – 2014. Strategy Total increase% CAGR% Number trades MaxDD% Fixed-no rebalance 24.03 2.15 0 -28.78 Target-25% rebalance 22.68 2.21 4 -27.04 Momentum-Adaptive 210.05 11.98 35 -16.41 The time evolution of the equity in the portfolios is shown in Figure 2. (click to enlarge) Figure 2. Equities of portfolios with 5% annual withdrawal rates. Source: This chart is based on EXCEL calculations using the adjusted monthly closing share prices of securities. To illustrate the effect of the withdrawal rates on the evolution of the capital we report simulation results for two strategies: fixed target with rebalancing and momentum-based adaptive asset allocation. In Table 3 we report the results of simulations of the fixed target portfolio with the following withdrawal rates: 0%, 5%, 6%, 8%, and 10%. The time evolution of the equity in the portfolios is shown in Figure 3. To illustrate the advantage of the adaptive allocation strategy and the effect of withdrawal rates on the evolution of the capital, we give in Table 3 the results of simulations for the following withdrawal rates: 0%, 5%, 10%, and 12%. Table 3. Adaptive Portfolios with various annual withdrawal rates 2005 – 2014. Withdrawal rate % Total increase% CAGR% MaxDD% 0 330.90 15.73 -13.97 5 210.05 11.98 -16.41 10 89.54 6.60 -20.24 12 41.20 3.51 -22.23 The time evolution of the equity in the portfolios is shown in Figure 3. (click to enlarge) Figure 3. Equities of momentum-based portfolios with various annual withdrawal rates. Source: This chart is based on EXCEL calculations using the adjusted monthly closing share prices of securities. Conclusion The set of three American Century mutual funds, selected for this study, perform well for all three strategies and generate sustainable returns at relatively low drawdowns. Between 2005 and 2015, the fixed target allocation with rebalancing was able to sustain withdrawal rates of up to 6% annually. The adaptive allocation algorithm was able to sustain withdrawal rates up to 13% annually without any decrease of capital. We must admit here that the performance of the portfolio selected in this article is by no means the best possible. Without doubt, there may be other selections that would have performed better. On the other hand, past performance does not guarantee future results. Finding the best portfolio even for a specified past time interval is a great undertaking. All we can do is to strive toward finding one of the best, not really the best. Same philosophy applies into selecting the family of funds. In an article at the end of the series we will present a comparative study of their relative performance. Disclosure: The author has no positions in any stocks mentioned, and no plans to initiate any positions within the next 72 hours. (More…) The author wrote this article themselves, and it expresses their own opinions. The author is not receiving compensation for it (other than from Seeking Alpha). The author has no business relationship with any company whose stock is mentioned in this article. Additional disclosure: This article is the fourth in a sequence on investing in mutual funds for retirement accounts. To help the reader compare the past performance of various mutual fund families, I selected a benchmark 10-year time interval starting on 1 January 2005 and ending on 31 December 2014. The article was written for educational purposes and should not be considered as specific investment advice.
Is FirstEnergy’s Rally Driven By Low U.S. Treasury Yields?

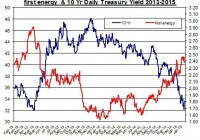
Summary FirstEnergy’s stock added nearly 30% in the past six months. Have low U.S. treasury yields increased the demand for FirstEnergy? What are the other factors that could also drive up shares of FirstEnergy? Shares of FirstEnergy (NYSE: FE ) have added nearly 30% to their value in the past six months. The common notion is that falling U.S. treasury yields tend to increase the demand for utility companies such as FirstEnergy. But is this the case? Also, what are some of the other factors that could drive up the price of FirstEnergy? Do U.S. treasury yields matter? To answer this question, let’s examine the relation of the 10 year treasury yield and the movement in FirstEnergy’s stock over the last couple of years. Source of data taken from Google Finance and U.S. Treasury At first glance we can see in times when treasury yields have gone down, as was the case in recent months, the stock of FirstEnergy rallied and vice versa. But after reviewing the linear correlation between the two sets of data – the correlation for the period was only -0.05 – it’s harder to make the case for a strong relation between U.S. treasury yields and FirstEnergy. But still the relation could be more a matter of people slowly moving their funds to utility companies such as FirstEnergy rather than having a direct clear cut reaction to these changes in the market. In other words, the relation could be more in the trend line than in the day to day shifts. This could all change if the FOMC were to start to raise its cash rate in the second half of the year, which should increase treasury yields. One of the main reasons people like to invest in utility companies such as FirstEnergy is for its stability and relatively high yields. The current annual dividend yield is 3.6%. In comparison, Exelon (NYSE: EXC ) and Duke Energy (NYSE: DUK ) also offer similar dividend yields of 3.4% and 3.7%, respectively. But these factors aren’t the only reasons for the higher demand for FirstEnergy. Here are a few of more reasons to consider: The company is also aiming to expand its operations: FirstEnergy is in the midst of a potential of $7 billion investment in transmission across 24,000 mile transmission system in its Regulated Transmission segment – which transmits electricity through transmission facilities. Back in 2014 the company allocated $4.2 billion for this investment, which is expected to conclude in 2017 and result in the upgrade and expansion of the transmission system. For 2014, the company estimated capex for this project to reach $1.35 billion. These investments will be funded via debt, issuing stocks, employment benefits and cash. Electricity generation is expected to rise in 2015 Based on the latest report by the Energy Information Administration , consumption of electricity in the residential sector is expected to slightly decline by 0.3% in 2015, year over year. This is mainly due to 12% drop in heating degree days this year compared to 2014. Despite the lower demand for electricity in the residential sector, electricity generation is still projected to rise by 1.1% in 2015. Moreover, the EIA also estimates retail residential prices to rise by 1.1% in 2015. This could suggest higher revenue for utility companies such as FirstEnergy. The company will release its fourth quarter report at the end of February, in which the company may provide an update on its guidance for 2015. Lower coal and natural gas prices Another thing that plays in favor for FirstEnergy is the currently low coal and natural gas prices. The company’s fuel mix includes 57% coal and 8% natural gas. The current price of coal (Central Appalachian) is around $46 per short ton – back in early 2014 the price was close to $60 per short ton. Moreover, natural gas is roughly $2.6. In comparison, back in February 2014 the price of natural gas was over $5. The low energy prices are likely to improve FirstEnergy’s profit margin in the first quarter of 2015 and subsequent quarters, assuming coal and natural gas prices remain at their current low levels. Takeaway FirstEnergy is benefiting from low energy prices, falling U.S. treasury yields and potential rise in retail prices in the coming months. These factors are likely to keep the company an interesting investment opportunity. Disclosure: The author has no positions in any stocks mentioned, and no plans to initiate any positions within the next 72 hours. (More…) The author wrote this article themselves, and it expresses their own opinions. The author is not receiving compensation for it (other than from Seeking Alpha). The author has no business relationship with any company whose stock is mentioned in this article.

4 Ways Alternatives Can Prepare Portfolios For The Future

Summary Many advisors and their clients are now in the process of reviewing last year’s performance and discussing how to best position their portfolios for what’s to come. I believe they should examine how alternative investments could be included in portfolios to potentially help achieve specific investment objectives. This piece lists four ways investors can use alternatives in seeking to meet common objectives. By Walter Davis Many advisors and their clients are now in the process of reviewing last year’s performance and discussing how to best position their portfolios for what’s to come. These reviews are taking place against the backdrop of a multi-year bull market in equities, low interest rates, low levels of market volatility, a strengthening dollar and declining oil prices. As advisors and clients look to navigate this landscape, I believe they should examine how alternative investments could be included in portfolios to potentially help achieve specific investment objectives. To help with this task, I have listed four ways investors can use alternatives in seeking to meet common objectives. Objective: Continue to participate in equity market upside, but with some downside protection. Investors have enjoyed a strong run in equities over the past six years, and most analysts I have read predict 2015 to be another positive year. That said, investors have also seen increased risks come into the market, such as Greece’s future in the eurozone. For investors looking to participate in a rising equity market, while also seeking to limit the downside if the market declines, equity long/short funds may be able to help. Equity long/short funds combine both long and short equity positions in a portfolio, while typically being net long to equities. In these types of funds, the long positions would be expected to capture gains in a rising equity market environment while the short positions would be expected to profit in a falling market environment. Because these funds are frequently net long, the direction of fund performance often tracks that of the overall market. Objective: Participate in market opportunities outside of stocks and bonds, such as in the commodity and currency markets. In 2014, the U.S. dollar appreciated over 10% against its counterparts, and the price of oil fell by almost 50%. Global macro funds invest across the global markets in equities, fixed income, currencies and commodities on a long and short basis. Such funds could have had the opportunity to profit from the rally in the U.S. dollar through long U.S. dollar positions, as well as from the decline in oil through short oil positions. Objective: Cushion portfolio during market swings . One theme I have seen repeatedly mentioned by market analysts is the return of market volatility to normal historic levels. Over the past six months, we have seen short periods of heightened market volatility, most recently during the first two trading weeks of 2015. For investors looking to cushion their portfolio during increased market swings, market neutral funds might be appealing options. Such funds seek to eliminate the impact of broad market movements by trading related stocks on a long and short basis, and seek to generate positive returns regardless of market environment. Objective: Generate attractive levels of income in the current low interest rate environment . With interest rates at historic lows, many investors, especially retirees, are seeking to earn an attractive level of current income off their investments. Two places that investors can explore are real estate income funds and bank loan funds. Real estate income funds invest in global real estate equity and fixed income securities and seek attractive current income. Bank loan funds seek to provide a high level of current income and capital appreciation by investing in senior loans made to corporations (usually rated below investment grade) by large banks and other financial institutions. Important Information Before investing, carefully read the prospectus and/or summary prospectus and carefully consider the investment objectives, risks, charges and expenses. For this and more complete information about the products, visit invesco.com/fundprospectus for a prospectus/summary prospectus. There is no guarantee the strategies discussed will meet their investment objectives. Investors should consider their risk tolerance and individual situation and carefully review all financial information before investing. Alternative products typically hold more non-traditional investments and employ more complex trading strategies, including hedging and leveraging through derivatives, short selling and opportunistic strategies that change with market conditions. Investors considering alternatives should be aware of their unique characteristics and additional risks from the strategies they use. Like all investments, performance will fluctuate. You can lose money. The dollar value of foreign investments will be affected by changes in the exchange rates between the dollar and the currencies in which those investments are traded. Commodities may subject an investor to greater volatility than traditional securities such as stocks and bonds and can fluctuate significantly based on weather, political, tax, and other regulatory and market developments. Investments in real estate related instruments may be affected by economic, legal, or environmental factors that affect property values, rents or occupancies of real estate. Real estate companies, including REITs or similar structures, tend to be small and mid-cap companies and their shares may be more volatile and less liquid. Most senior loans are made to corporations with below investment-grade credit ratings and are subject to significant credit, valuation and liquidity risk. The value of the collateral securing a loan may not be sufficient to cover the amount owed, may be found invalid or may be used to pay other outstanding obligations of the borrower under applicable law. There is also the risk that the collateral may be difficult to liquidate, or that a majority of the collateral may be illiquid. Short sales may cause an investor to repurchase a security at a higher price, causing a loss. As there is no limit on how much the price of the security can increase, exposure to potential loss is unlimited. The information provided is for educational purposes only and does not constitute a recommendation of the suitability of any investment strategy for a particular investor. Invesco does not provide tax advice. The tax information contained herein is general and is not exhaustive by nature. Federal and state tax laws are complex and constantly changing. Investors should always consult their own legal or tax professional for information concerning their individual situation. The opinions expressed are those of the authors, are based on current market conditions and are subject to change without notice. These opinions may differ from those of other Invesco investment professionals. NOT FDIC INSURED MAY LOSE VALUE NO BANK GUARANTEE All data provided by Invesco unless otherwise noted. Invesco Distributors, Inc. is the U.S. distributor for Invesco Ltd.’s retail products and collective trust funds. Invesco Advisers, Inc. and other affiliated investment advisers mentioned provide investment advisory services and do not sell securities. Invesco Unit Investment Trusts are distributed by the sponsor, Invesco Capital Markets, Inc., and broker-dealers including Invesco Distributors, Inc. PowerShares® is a registered trademark of Invesco PowerShares Capital Management LLC (Invesco PowerShares). Each entity is an indirect, wholly owned subsidiary of Invesco Ltd. ©2014 Invesco Ltd. All rights reserved. blog.invesco.us.com