Tag Archives: alternative

Low Volatility & Momentum: Doubling The Market Return
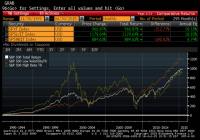
Summary This series offers an expansive look at the Low Volatility Anomaly, or why lower risk stocks have historically produced stronger risk-adjusted returns than higher risk stocks or the broader market. While low volatility strategies are often an appropriate long-term buy-and-hold strategy, this article offers a strategy that uses a momentum signal to tilt towards higher beta securities selectively. The alpha-generative strategy combines two market anomalies – Low Volatility and Momentum – to produce outsized returns. In recent articles, I have been authoring a fairly extensive examination of the Low Volatility Anomaly, the tendency for low volatility assets to outpeform high beta assets over long-time intervals. A Low Volatility strategy was one of five buy-and-hold factor tilts that I described in a previous series of articles. I believe that these buy-and-hold strategies to capture structural alpha are appropriate for many in the Seeking Alpha audience, but understand that some readers are looking for strategies that can generate even higher absolute returns. This article depicts one such strategy. Long-time readers know that two of favorite topics on which to author have been Low Volatility and Momentum strategies. This article combines these two strategies to produce a return profile that as the title of the article suggests has more than doubled the return of the S&P 500 over the past quarter-century. Before we delve into this strategy, we should first discuss the two components that drive this tremendous performance. Low Volatility Anomaly Regular readers know that I am currently authoring a multi-part series on the Low Volatility Anomaly. These articles include an introduction to the concept, a theoretical underpinning for the anomaly , cognitive and market structure factors that contribute to its long-run performance, and empirical evidence that demonstrates the outperformance of low volatility strategies across markets, geographies and long-time intervals. In past articles, I have depicted the relative outperformance of Low Volatility strategies using the graph below which shows the cumulative total return profile (including reinvested dividends) of the S&P 500 (NYSEARCA: SPY ), the S&P 500 Low Volatility Index (NYSEARCA: SPLV ), and the S&P 500 High Beta Index (NYSEARCA: SPHB ) over the past twenty-five years. The volatility-tilted indices are comprised of the one-hundred lowest (highest) volatility constituents of the S&P 500 based on daily price variability over the trailing one year, rebalanced quarterly, and weighted by inverse (direct) volatility. Source: Standard and Poor’s; Bloomberg The Low Volatility strategy contributes an important base component to this strategy that would have doubled the return of the market over the past twenty-five years, but we also need an element that pushes the strategy into riskier parts of the market when we can get paid for this tilt in the form of higher returns. Momentum Like the low volatility strategy, momentum strategies have been alpha-generative over long-time intervals and across markets. Consistent with Jegadeesh and Titman (1993), which documented momentum in stock prices that have outperformed in the recent past over short forward intervals, the efficacy of momentum strategies have been widely documented. Academic literature has described excess returns generated by momentum strategies in foreign stocks ( Fama and French 2011 ), multiple asset classes ( Schleifer and Summers 1990 ), commodities ( Gorton, Hayashi and Rouwenhorst 2008 ), and my own studies on momentum in fixed income strategies and more recently the oil market . Academic literature offers competing theories on why momentum has generated alpha over long-time intervals across markets and geographies. Proponents of market efficiency suggest that momentum is a unique risk premium, and the long-run profitability of these strategies is compensation for this unique systematic risk factor ( Carhart 1997 ). Behaviorists offer multiple competing explanations. In my previous series, I referenced both Lottery Preferences and Overconfidence as potential justifications. Studies contend that markets under-react to new information ( Hong and Stein 1999 ), which allows for the autocorrelations found in return series. Other behavioral economists contend that the disposition effect, or the tendency for investors to pocket gains and avoid losses, makes investors prone to sell winners early and hold onto losers too long ( Frazzini 2006 ), which could be further amplified by a “bandwagon effect” that leads investors to favor stocks with recent outperformance. Blitz, Falkenstein and Van Vliet (2013) offer an expansive summary of these explanations. The Strategy I am of the opinion that low volatility stocks should be a part of investors’ longer-term strategic asset allocation given that class of stocks’ historical higher average returns and lower variability of returns. In ” Making Buffett’s Alpha Your Own ,” I described academic research ( Frazzini, Kabiller, Pederson 2013 ) that broke down the Oracle of Omaha’s tremendous track record at Berkshire Hathaway ( BRK.A , BRK.B ) into two components – capturing the Low Volatility Anomaly and the application of leverage. If an allocation to low volatility stocks should be part of your long-term strategic asset allocation, then an allocation to high beta stocks must be done tactically with a short-term focus given that class of stocks’ lower long run average returns and higher variability of returns. This view is borne out of the data underpinning the chart above. However, a temporary allocation to the High Beta Index in sharply rising markets can further boost performance. The High Beta stock index has typically outperformed in post-recession recoveries. How do we combine Low Volatility and Momentum? A quarterly switching strategy between the Low Volatility Index and the High Beta Index, which buys the leg that has outperformed over the trailing quarter and holds that leg forward for the subsequent quarter, would have produced the return profile seen below since 1990, easily besting the S&P 500 with lower return volatility. For a pictorial demonstration of the leg that would be chosen by the Momentum strategy, please see the exhibit at the end of the article. It is a very simple heuristic. The Momentum strategy buys either Low Vol or High Beta stocks based on the index that outperformed in the trailing quarter and holds that index for the subsequent quarter before re-examining the allocation once again. The results are striking. (click to enlarge) From the cumulative return graph above, one can see that $1 invested in the S&P 500 would have produced $9.04 at the end of the period (including reinvested dividends) whereas $1 invested in the Momentum portfolio would have produced $19.90. These are gross index returns and do not consider taxes. Readers envisioning employing momentum strategies should utilize tax-deferred accounts. Summary statistics of the trade are captured below: (click to enlarge) The simple quarterly switching momentum strategy would have produced a 13% return per annum over the long sample period. This 3.6% outperformance relative to the S&P 500 led to the cumulative doubling of the market returns over time. Note that while the Momentum strategy is riskier than the broad market as measured by the variability of quarterly returns, practitioners of this strategy would have been rewarded with correspondingly higher returns for this incremental risk. While I contend that a long-run, buy-and-hold tilt towards lower volatility equity is probably appropriate for many Seeking Alpha readers, this article demonstrates a momentum-based switching strategy that can help inform investors when to pivot towards higher beta stocks when they offer returns commensurate with their higher risk. Disclaimer My articles may contain statements and projections that are forward-looking in nature, and therefore inherently subject to numerous risks, uncertainties and assumptions. While my articles focus on generating long-term risk-adjusted returns, investment decisions necessarily involve the risk of loss of principal. Individual investor circumstances vary significantly, and information gleaned from my articles should be applied to your own unique investment situation, objectives, risk tolerance, and investment horizon. Exhibit: Returns of Low Vol, High Beta, Momentum, & Market (click to enlarge) Disclosure: I am/we are long SPLV, SPHB. (More…) I wrote this article myself, and it expresses my own opinions. I am not receiving compensation for it (other than from Seeking Alpha). I have no business relationship with any company whose stock is mentioned in this article.
Vanguard Long-Term Corporate Bond Index ETF: A Great Bond Option If You Don’t Mind The Duration

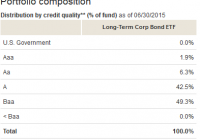
Summary The Vanguard Long-Term Corporate Bond Index ETF takes on some credit risk and quite a bit of duration risk to deliver better yields. The ideal exposure for bond investors would probably include other bond funds for more diversification on credit grades and durations. The low expense ratio is respectable. The Vanguard Long-Term Corporate Bond Index ETF (NASDAQ: VCLT ) is a solid bond fund. As I’ve been searching for appealing bond funds, I’ve found some of my favorites are from Vanguard. Given my distaste for high expense ratios, it should be no surprise that Vanguard products would be appealing. After looking through the portfolio, I think the holdings are fairly reasonable for an investor wanting to regularly keep part of their portfolio in a bond fund. With that said, I have to admit that the duration is fairly long and I’d really like to see stronger yields when taking on this level of duration risk. This would be a dangerous holding for an investor with a fairly short time horizon. For the investor with a long-term horizon, a small allocation here makes sense. Quick Introduction The Vanguard Long-Term Corporate Bond Index ETF is showing a yield to maturity of 4.9% and an average duration of 13.5 years. The yield gives investors a reason to take on the interest rate risk. Credit Quality When I first looked at the credit quality of the Vanguard Long-Term Corporate Bond Index ETF, my first impression was that the credit ratings were stacked pretty close together. The vast majority of the portfolio is rated A or Baa as shown below: It isn’t just the credit ratings that are stacked to a fairly small part of the curve, we also see the effective maturity is very long. Keep in mind that effective maturity is not the same as duration. The average effective maturity is 24 years. Maturities I grabbed another chart to show the effective maturity on the securities: Since we are getting a reasonable yield in a very low interest rate environment it shouldn’t be surprising to see that the maturities are fairly long. However, we are seeing quite a bit of concentration here as well. Because the credit risk and effective maturity are both heavily focused on specific parts of the curve, there is a meaningful amount of diversifiable risk left in the holdings. Risk The easiest way to control for the risk from the concentration of the holdings is simply to combine a few bond ETFs. In my estimate, VCLT is a very solid bond ETF that is at its best when it is combined with other bond ETFs to create the bond portion of a portfolio. Having so much concentration on the risk factors would be a problem if the investor only held VCLT, but very specific exposure can be a desirable factor when an investor is trying to figure out how to fit the bond ETF into their portfolio. Conclusion As far as bond ETFs go, the Vanguard Long-Term Corporate Bond Index ETF is a fairly solid option. For investors that get free trading on the ETF, it is even better because it would be easier to handle rebalancing to take advantage of the diversification benefits that the long-term bond portfolio can bring to a portfolio. The expense ratio is low which is an important selling point. With bond yields already being fairly low, having a high expense ratio is a quick way to get a real drag on any returns from interest payments. If an investor prefers to be a speculator and just wants to bet on rates going lower and getting price appreciation, then the expense ratio is less of an issue. For the long-term holder planning to keep high quality bond ETFs in their portfolio for the next few decades, the low expense ratios are an important factor. Due to the volatility created by having a fairly long duration, I would really favor a strategy with automatic rebalancing and a long time horizon. Disclosure: I/we have no positions in any stocks mentioned, and no plans to initiate any positions within the next 72 hours. (More…) I wrote this article myself, and it expresses my own opinions. I am not receiving compensation for it (other than from Seeking Alpha). I have no business relationship with any company whose stock is mentioned in this article. Additional disclosure: Information in this article represents the opinion of the analyst. All statements are represented as opinions, rather than facts, and should not be construed as advice to buy or sell a security. Ratings of “outperform” and “underperform” reflect the analyst’s estimation of a divergence between the market value for a security and the price that would be appropriate given the potential for risks and returns relative to other securities. The analyst does not know your particular objectives for returns or constraints upon investing. All investors are encouraged to do their own research before making any investment decision. Information is regularly obtained from Yahoo Finance, Google Finance, and SEC Database. If Yahoo, Google, or the SEC database contained faulty or old information it could be incorporated into my analysis.

SCHD Is A Great Diversification Option For Dividend Growth Investors In Utilities

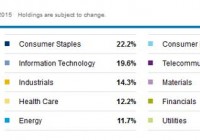
Summary SCHD is a great ETF with almost no utilities. Dividend growth investors are prone to liking utilities for reliable dividend growth. The holdings of SCHD offer great diversification across the other sectors at a very reasonable cost. The Schwab U.S. Dividend Equity ETF (NYSEARCA: SCHD ) offers investors a very interesting combination. As an ETF, it posts a fairly reasonable dividend yield of 2.88%; however, many dividend growth investors may turn their nose up at the weaker yield as their own portfolios are likely to produce a higher dividend yield. It is understandable that investors buying into a dividend ETF would have a strong focus on generating enough dividend yield to support their retirement. A Supplemental Holding While it is understandable that a 2.88% yield may be insufficient for investors that want to see their living expenses covered by dividends, it is still common for investors to need significant diversification in their holdings. When an investor builds a portfolio on the basis of high dividend yields, they may introduce a large amount of idiosyncratic risk because they will heavily overweight certain sectors. One common area for the dividend growth investors to focus on is the use of utility stocks. Using utility stocks as a major source of dividends is a fine strategy. Utilities can often benefit from having a regulated monopoly that protects their margins in tough times. If we look at risk factors from the perspective of the human in their entirety, we can say that higher utility prices are a natural risk for people. Owning the supplier of those utilities is a nice way to hedge against the risk of paying higher prices. When using SCHD to supplement a portfolio, the holdings of SCHD are a nice complement to what the investor might naturally pick. While the investor may focus on covering utility stocks, SCHD almost entirely excludes them. That means for the investor that is already holding utility stocks individually or holding a utility ETF, they will have significantly less duplication of holdings because SCHD is delivering the other dividend companies. The sector exposure is shown below: (click to enlarge) On The Other Hand While I love the way the portfolio is constructed and think it is a great complement to a portfolio that is heavy on utilities, investors should still be aware that if they are also picking stocks outside of the utility sector there could easily be some overlap. The top 10 individual holdings are demonstrated below: (click to enlarge) When you look at the top 10 companies, you’ll see many that may already be in your portfolio. That makes it a question of how much research you want to do into the individual large dividend payers. By focusing on the utilities an investor can effectively grab diversification through SCHD with an expense ratio of only .07%. For the cost, this is fairly solid diversification as long as the investor is not already holding several of the companies in their portfolio. A Third Option For investors that really want to make their portfolio entirely from scratch, SCHD has one last use. The holdings list creates a decent starting list for companies to research. One of the things that I like about the list is that they prominently feature gas companies in Exxon Mobil (NYSE: XOM ) and Chevron Corp. (NYSE: CVX ). While gas prices have become very low, they still remain a substantial risk factor for retirees. When gas prices are increasing, it means the investor will have to pay more to fill up their own car and the other companies that are transporting physical goods will be dealing with higher costs of transporting their inventory. Those factors make the oil companies natural holdings for an investor that wants to diversify against their own risk factors. Conclusion The Schwab U.S. Dividend Equity ETF is a great ETF for buying dividend yield. If an investor really wants to focus on dividend yield, they should be looking to use SCHD as a supplemental holding to diversify risk with a portfolio that holds more equity REITs and utilities. While I cover the mREITs frequently, I wouldn’t suggest investors buy into the sector until they know precisely what they are doing. Disclosure: I/we have no positions in any stocks mentioned, but may initiate a long position in SCHD over the next 72 hours. (More…) I wrote this article myself, and it expresses my own opinions. I am not receiving compensation for it (other than from Seeking Alpha). I have no business relationship with any company whose stock is mentioned in this article. Additional disclosure: Information in this article represents the opinion of the analyst. All statements are represented as opinions, rather than facts, and should not be construed as advice to buy or sell a security. Ratings of “outperform” and “underperform” reflect the analyst’s estimation of a divergence between the market value for a security and the price that would be appropriate given the potential for risks and returns relative to other securities. The analyst does not know your particular objectives for returns or constraints upon investing. All investors are encouraged to do their own research before making any investment decision. Information is regularly obtained from Yahoo Finance, Google Finance, and SEC Database. If Yahoo, Google, or the SEC database contained faulty or old information it could be incorporated into my analysis.