Tag Archives: alternative

New Normal Income

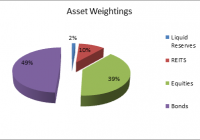
The State Street Fund is mainly comprised of the well-known SPDR ‘Sector Select’ funds. An Income Allocation fund provides better returns than a Government Bond fund. An Income Allocation fund is less risky than a high yield fund. Investors are living in interesting times. Before the 2008 credit crisis, the only mention of deflation might be heard or described in a television documentary. Deflation , as far as most people were concerned, was a thing of the past, the aftermath of an asset bubble combined with a naive economic policy. To be sure, deflation may have faded in living memory, but was still very much a reality of macroeconomics. Since 2008, many advanced global economies have been slipping in and out of deflation and their central banks have been walking a fine line on decisions to direct economic policy. The problem, it seems, is primarily due to a digitally connected, integrated global economy. Disinflation in one region will directly or indirectly affect interest rates and currency values in others. This ‘network effect’ has impacted individual investors who seek relatively safe income. However, to attain reasonable incomes, investors now must venture further out on the risk curve. This begs the question whether there’s some comfortable median, in particular, a way to reasonable returns without incurring high risk. State Street Global Advisors offers investors the opportunity to do just that; earn a steady stream of income with manageable risk through its actively managed SPDR Income Allocation ETF (NYSEARCA: INKM ) . According to State Street the fund’s objective seeks to: Provide total return by focusing on investment in income and yield-generating assets. The fund tracks primarily the MSCI World Index , and secondarily , Barclays U.S. Long Government/Credit Bond Index . According to the prospectus , the fund invests primarily in four different asset classes through exchange traded products (ETP): domestic and international equities; domestic and international investment grade and high yield debt securities; preferred and convertible securities and lastly, real estate investment trusts. Since the fund seeks to achieve its objectives through investments in Exchange Traded Products it is essentially a fund of funds. There are similar funds; however, SPDR’s Income Allocation ETF has the best short and long term returns when compared to the top three similar as summarized below: Fund and Inception 1 Month YTD 1 Year 3 Year Since Inception Types of Holdings SPDR (INKM) 4/25/2012 1.25% -0.35% 1.07% 5.10% 5.46 ETP; Reits convertibles, Equities PowerShares CEF Income Composite Portfolio ETF (NYSEARCA: PCEF ) 2/19/2010 -1.61 0.84 -3.04 5.52 6.41 ETP investment grade funds; high yield funds iShares Morningstar Multi-Asset High Income Index ETF (BATS: IYLD ) 4/3/2012 -0.55 -2.57 -2.65 4.15 5.21 ETPs, high yield fixed income funds (Data From State Street Global Advisor ) T he fund is compact, holding just 21 funds; 17 of those holdings are State Street Advisor’s SPDR funds . Of the top five holdings accounting for nearly half of the fund’s asset allocations, three are SPDR bond funds, one SPDR REIT and the WisdomTree Japan Hedged Equity ETF (NYSEARCA: DXJ ) . (Data from State Street) The fund’s heaviest allocation is in bonds, accounting for nearly half of the funds asset allocation. Of the 7 bond funds, 2 are U.S. Treasury bond funds, 10.83%; 2 are corporate bond funds, 14.32%; 1 high yield fund, 15.79%; 1 emerging market bond fund, 3.05%, and 1 convertible securities fund accounting for 5.08%, of total holdings. Hence, the fund is well diversified over the risk spectrum. The next heaviest allocation is in dividend generating equity funds. Of the 11 equity funds, 6 are international, 22.99%; three are SPDR ‘Select Sector’ funds, 6.09%; one SPDR preferred equity fund, 5.13% and one SPDR dividend fund accounting for 5.11% of the fund’s total holdings. Two SPDR REITs account for 10.27% of the fund’s holdings and lastly 1.34% is classified as ‘liquid reserves’. The question sure to arise is on the usefulness of allocating a fund of funds in a long term portfolio. The question may be answered when the long term investor makes a careful study of the global fixed income market. Most advanced economies are experiencing “disinflation’ or outright “deflation”. In order to prevent a deflationary spiral, central banks have gone to extraordinary lengths to depress deposit rates in order to direct liquidity into economies. These extreme efforts have met with some measure of success, but by far, have not returned fixed income markets to ‘normalcy’. Three recent notable examples of central bank actions in ‘secular stagnation’ economies are for instance, Japan’s unexpected expansion of its bond purchasing program in October of 2014 weakening the Yen to historic lows against major currencies; the ECB’s expansion of its bond purchasing program and depressing its deposit rate to -0.20%; most recently the People’s Bank of China reference rate reductions and an outright devaluation of the dollar pegged currency. The list is long and growing. Worsening the matter has been the commodity market collapse, particularly in crude oil and decelerating global demand. By all indication, the individual investor might, at the very best, expect a gradual return to normalcy, which might take several years. There’s a risk in being locked into historically low yielding high quality sovereign debt at the long end of the curve. Should sovereign rates return to normal after just a few years, the loss of principal on bonds purchased at the highs, would certainly result in a negative yield when held to maturity, particularly should inflation return to a 2% rate. On the other hand, should major global economies continue to struggle to “reflate”, even the most risky high yield bonds will experience declining yields. (click to enlarge) It has often been said that a ‘fund of funds’ results in over-diversification. In a new normal world, a fund of diversified fixed income funds, particularly if it’s actively managed such as the State Street Global Advisors Income Allocation Fund ETF is a far more holding tool for the individual investor, well diversified over many income producing sectors and, most importantly, diversifies risk as well. The fund has total net assets of $118.94 million distributed over the 21 holdings including the liquid reserves. The trailing dividend yield is currently 3.28% and the ETF shares currently are trading at its NAV price, hence neither at a premium nor discount to NAV; there are 3.80 million shares outstanding. The fund has a somewhat high management fee of 0.70% without any mention of waivers or cap. Disclosure: I/we have no positions in any stocks mentioned, and no plans to initiate any positions within the next 72 hours. (More…) I wrote this article myself, and it expresses my own opinions. I am not receiving compensation for it (other than from Seeking Alpha). I have no business relationship with any company whose stock is mentioned in this article. Additional disclosure: CFDs, spread betting and FX can result in losses exceeding your initial deposit. They are not suitable for everyone, so please ensure you understand the risks. Seek independent financial advice if necessary. Nothing in this article should be considered a personal recommendation. It does not account for your personal circumstances or appetite for risk.
Active Power: At An Inflection Point?

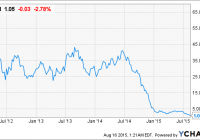
ACPW is a name that has long been a disappointment. But it appears that new management is showing to have an effect on shaping operations at the company – ACPW just reported its sixth quarter of greater than 1:1 book/bill. ACPW is also growing sales while managing higher gross margins – this had the effect of reducing overall cash burn, always a concern for microcaps. If ACPW can sustain its operating momentum it should scale up market cap with each quarter reported as the niche has a well-established EV/revenue multiple. Active Power (NASDAQ: ACPW ) is an interesting name that I came across recently. The company’s headquarters is coincidentally located just a few blocks away from my home. After passing by its offices time and time again, and this is a name that I’ve seen trend in the social arenas a few times over the last year, I decided to take a look into the filings. What I found looks like a company that might be at an inflection point that has long been in the making. First, ACPW is “engaged in designing, manufacturing and selling of flywheel-based uninterruptible power supply (“UPS”) products and modular infrastructure solutions (SOURCE: ACPW 10-K)”. Put simply, the company helps regulate power to facilities and entities that can ill afford to not have a steady power flow; and provides essential infrastructure to facilities and entities that want greater control over microgrids. The latter functionality taps into the burgeoning market for off-grid power production from a single or multiple sources of alternative energy production (e.g. solar power installations, wind power farms, etc.). Both UPS power regulation and microgrid applications are growing more evident value-props in 1) an increasingly stressed electrical infrastructure (international electrical infrastructures are already stressed) and 2) an infrastructure in which microgrids (read: hospitals, university campuses, massive server host facilities, etc.) are becoming more valuable. While these are long term, secular trends to be sure – there is no denying that the visibility of the necessity for equipment and services provided by ACPW is increasing. In that the value prop and visibility of value prop are set up in this instance to be longer term, I’m viewing ACPW as strictly a long-term buy and hold opportunity. Shares of ACPW likely will not trade sharply higher overnight, but I believe they will trade higher steadily over extended durations. (click to enlarge) In saying that, through 1H/15 reporting ACPW is showing to have steadily improving operations and a more consistently stable overall model. Trading at less than one times EV/revenue (TTM) and trading 30 bps below a peer group EV/revenue multiple average of 1X (consisting of Capstone Turbine (NASDAQ: CPST ), FuelCell Energy (NASDAQ: FCEL ), Maxwell Technologies (NASDAQ: MXWL ) and PowerSecure International (NYSE: POWR )), now might be a good time to consider initiating a position in ACPW. ACPW has generated ~$58 million in TTM revenues, showing a healthy revenue base for a microcap – certainly having such revenues allows the company certain flexibilities not inherent in pre/low revenue microcap models, and is on pace to achieve approximately the same figure in full year 2015 (annualizing 1H/15 performance – it should be noted that ACPW does report lumpy revenues from time to time). The company also recently posted its first quarter of positive Adjusted EBITDA in quite some time and greatly closed its long-standing net loss and negative EPS: (click to enlarge) When coupling this income statement performance with the fact that the company has ~$10.6 million in C&CE on its balance sheet, $37.4 million in assets, $19.8 million in liabilities, and $5.5 million in debt, I consider the company to not be at any near-term structural risk. ACPW’s cash, which is always important to monitor in this market cap space, should last at least the next 12 months. I anticipate the cash balance will likely last much longer, basing this assumption on ACPW’s 10-K filing and cash burn generally associated with total net loss. I could realistically see full year 2015, which through 1H/15 ACPW has shown roughly half the total cash burn as 1H/14, being the lowest cash burn print in 4 years . If ACPW can prove out 2015 to be at or near cash flow breakeven, management has not given guidance to this, this would materially move forward the bull case. Typically with microcaps, dilution and/or a reliance on debt as a result of high rates of cash burn is at or near the top of the risk list. ACPW, depending on sales ramp, might be close to negating this risk. In regards to sales at ACPW, upon reviewing the company’s 10-K filing for the year ended 12/31/14 this was a red flag to me in considering ACPW for a bullish recommendation. I noticed that the company had, as of its now 6-month-old 10-K filing, a history of falling sales on flat operating expenses – which was particularly concerning. I also knew that ACPW had changed management teams less than two years ago and the lack of progress visible on the topline was adding to my initial concerns. However, when viewing the current year’s Q1 and Q2 10-Q filings, of course, I saw the data illustrated in the image above which speaks quite to the contrary of the performance in the 10-K. ACPW appears to have turned a corner in selling as of the first two quarters of 2015. Still, even knowing this, it was encouraging to see that ACPW broke out its sales in its August Investor Deck into book to bill ratios. ACPW, as of Q2/15, reported its sixth consecutive quarter of a greater than 1.0 book to bill ratio – this has led to a much healthier trend line: (click to enlarge) Again, this increased consistency and overall scale has led to a return to positive Adjusted EBITDA for ACPW as well as increasing gross margins – another sign of increasing operating health: (click to enlarge) Finally, it should be noted that ACPW has fragmented and diversified both its geographical revenue dependence as well as its dependence on any singular revenue channel – yet more reasons to believe that the increased book to bill ratio is sustainable under the new regime: (click to enlarge) All told I believe ACPW is deserving of a hard look at this point in its development by those interested in securing an ownership in electrical grid and microgrid management. I don’t believe there is any denying that there are secular growth trends supporting both a need and desire for these types of services. ACPW, while being largely a disappointment since its IPO many years ago, appears to be changing course under new management. The story at ACPW has been slowly progressing – to management’s credit this does have quite a bit to do with the fact that ACPW is a capital equipment company – but it is now having a positive effect on the company’s health. If ACPW is at an inflection point, which I’m leaning heavily into the fact that it is, it should be able to grow its market cap. Despite improved financial performance in the first half of the year, the stock has not moved. The realization of a continuation of greater than 1:1 book to bill ratios bodes well for the company and its shares. Good luck everybody. Editor’s Note: This article covers one or more stocks trading at less than $1 per share and/or with less than a $100 million market cap. Please be aware of the risks associated with these stocks. Disclosure: I/we have no positions in any stocks mentioned, and no plans to initiate any positions within the next 72 hours. (More…) I wrote this article myself, and it expresses my own opinions. I am not receiving compensation for it (other than from Seeking Alpha). I have no business relationship with any company whose stock is mentioned in this article.

XLE: Diversified Exposure For An Oil Rally

Summary For those who believe the oil market is going to rally, an Energy Sector ETF can provide diversified exposure. I will compare to XLE to two viable alternatives. Broad energy market ETFs reduce single stock and sub-sector risk by providing up, down, and mid stream energy exposure. Introduction I am an ETF believer. I think ETFs reduce cognitive bias and risk. I believe they provide adequate exposure and diversification when utilized properly. Each ETF comes with different equity weightings, expense, volume, yield, correlation, etc., so I have spent time recently comparing key metrics to narrow down the vast number of ETFs on the market. Crude Oil has recently tanked into the mid to low 40s, and some investors believe now is the time to capitalize on a cheap energy market. For those interested in buying into oil and gas, I recommend you avoid risky ETNs like UWTI and UGAZ . Instead, I recommend buying a less risky long-term position in a broad market energy ETF. ETNs and Unnecessary Risk Certain leveraged ETNs provide direct exposure to the oil market; however, I believe some are unnecessarily risky. In this case, a largely traded ETN like the VelocityShares 3X Long Crude Oil ETN (NYSEARCA: UWTI ) would provide an attractive amount of liquidity based on its high trading volume. However, this type of fund is associated with a veritable laundry list of risks including tracking error, compounding risk, and expensive fees. These funds perform sub optimally in flat or declining environments, and they generally decline significantly over time. For more information on the risks of multiplied leverage and daily tracking risk see my article here . To help visualize the sharp decline, I’ll include a relevant graph. Other more conservative options include 1X ETNs that don’t suffer from the same long-term tracking error as a 3X ETN. (2X and 3X ETNs in particular are meant to be used by professionals to accomplish short term objectives.) An example of a direct investment in the oil market includes the United States Oil Fund ETF (NYSEARCA: USO ). In theory, USO would provide a much stronger correlation to the underlying oil market. However, I believe strongly that an ETF designed towards broad market exposure will outperform the underlying oil market. While the 1X ETN has a better correlation, and ETF is not limited strictly by the change in the underlying index (oil price). A well-crafted, highly liquid energy ETF, provides additional incentives such as dividends, and it achieves returns based on the weighted performance of its portfolio holdings. An ETN designed to track an index is limited to the fluctuations of the price of the underlying commodity. A sector ETF on the other hand is based on the growth capabilities and stock performance of its energy holdings. It is clear that XLE is more capable of mitigating its downside in a weak environment whilst maximizing returns in a bull market. I believe companies are able to develop strategies that allow for protection from fluctuations in price. An Oil Rally With Brent at 49.15 and WTI at 42.50, some believe the oil market has been dramatically oversold. The argument for an oil rally is essentially this: overly negative sentiment towards a supply gut and geopolitical events (like the Iran deal) has led to an unprecedented market sell off that has driven oil prices to six year lows. Now is the time to capitalize on cheap oil. We are currently in an environment similar to early March, and oil will return to prices closer to 55-60 dollars a barrel (WTI). If you hold to this belief, I recommend choosing an energy ETF that will perform optimally in a variety of environments. The integrated broad market exposure will allow the investor to reduce the risk of betting solely on the performance of the underlying commodity ((oil)). XLE & Two Alternatives Currently I am invested in the Energy Select Sector SPDR ETF (NYSEARCA: XLE ), and I will make the case for XLE in this article. In an effort to provide you with additional high quality options, I will also analyze the Vanguard Energy ETF (NYSEARCA: VDE ) and the iShares U.S. Energy ETF (NYSEARCA: IYE ). There are other energy plays. Some ETFs focus specifically on the E&P side while others have more exposure to global performance. I liked XLE, VDE, and IYE because they are more focused on North American Companies (Exxon (NYSE: XOM ), Chevron (NYSE: CVX ), Etc.) with a global presence in all aspects of the energy market. These ETFs are also have the largest amount of net assets and provide desirable liquidity. Correlation I always mention correlation because you want the ETF to closely track (if not outperform) the underlying index. If it does not do this, then the ETF is likely inefficiently weighted. With long plays, short term correlation is less important, but I will include a graph to show how each ETF performs relative to its index. ^SS1J data by YCharts I compared each ETF to the S&P 500 Equal Weighted Energy Sector Level % change. it is not a perfect correlation, but it does express the close relative grouping of each. Really all I’m looking for here is that each ETF does what it says it will do. Looking closer into 5-year returns, you’ll notice XLE outperformed both VDE and IYE by about 3.5%. Brief Portfolio Composition Look Each ETF is weighted towards each subsector of the broad energy market differently. For this reason, there is variety of tracking error and diversification differentiation. I made an excel sheet to express each sub-sector weighting. Portfolio Composition XLE VDE IYE Integrated Oil and Gas 32% 32% 34% E&P 29% 30% 31% Equipment & Service 17% 16% 17% Pipelines 10% 11% 7% Refiners 10% 8% 7% Drillers, Coal, Etc. 1% 2% 3% Key ETF Metrics I included some key metrics to make a valid comparison. While it does not necessarily dive into weighting or historical returns, it does help narrow down specific areas to think about. XLE VDE IYE Total Assets 11.28 Bil 3.68 Bil 1.19 Bil Avg. Volume 19.9 Mil 456,395 1.1 Mil Expense 0.15% 0.12% 0.45% SEC Yield 2.93% 3.01% 2.28% Turnover Ratio 5.25% 4.00% 7.00% Recommendation All three ETFs are tactical plays that offer exposure to the U.S. energy sector without taking on too much single equity risk. Historically XLE has performed the strongest in most market conditions. I attribute this to XLE’s large net assets and broad exposure (particularly downstream: refiners, pipelines etc.) Storage and Pipelines are not as hurt by excess supply because price reductions are mitigated by increased service demand. XLE has desirable liquidity, and it is extremely cheap (15 Basis points) with a near 3% yield. I believe XLE is the best energy ETF on the market. Disclosure: I am/we are long XLE. (More…) I wrote this article myself, and it expresses my own opinions. I am not receiving compensation for it (other than from Seeking Alpha). I have no business relationship with any company whose stock is mentioned in this article.