XLE: Diversified Exposure For An Oil Rally
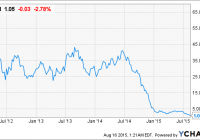
Summary For those who believe the oil market is going to rally, an Energy Sector ETF can provide diversified exposure. I will compare to XLE to two viable alternatives. Broad energy market ETFs reduce single stock and sub-sector risk by providing up, down, and mid stream energy exposure. Introduction I am an ETF believer. I think ETFs reduce cognitive bias and risk. I believe they provide adequate exposure and diversification when utilized properly. Each ETF comes with different equity weightings, expense, volume, yield, correlation, etc., so I have spent time recently comparing key metrics to narrow down the vast number of ETFs on the market. Crude Oil has recently tanked into the mid to low 40s, and some investors believe now is the time to capitalize on a cheap energy market. For those interested in buying into oil and gas, I recommend you avoid risky ETNs like UWTI and UGAZ . Instead, I recommend buying a less risky long-term position in a broad market energy ETF. ETNs and Unnecessary Risk Certain leveraged ETNs provide direct exposure to the oil market; however, I believe some are unnecessarily risky. In this case, a largely traded ETN like the VelocityShares 3X Long Crude Oil ETN (NYSEARCA: UWTI ) would provide an attractive amount of liquidity based on its high trading volume. However, this type of fund is associated with a veritable laundry list of risks including tracking error, compounding risk, and expensive fees. These funds perform sub optimally in flat or declining environments, and they generally decline significantly over time. For more information on the risks of multiplied leverage and daily tracking risk see my article here . To help visualize the sharp decline, I’ll include a relevant graph. Other more conservative options include 1X ETNs that don’t suffer from the same long-term tracking error as a 3X ETN. (2X and 3X ETNs in particular are meant to be used by professionals to accomplish short term objectives.) An example of a direct investment in the oil market includes the United States Oil Fund ETF (NYSEARCA: USO ). In theory, USO would provide a much stronger correlation to the underlying oil market. However, I believe strongly that an ETF designed towards broad market exposure will outperform the underlying oil market. While the 1X ETN has a better correlation, and ETF is not limited strictly by the change in the underlying index (oil price). A well-crafted, highly liquid energy ETF, provides additional incentives such as dividends, and it achieves returns based on the weighted performance of its portfolio holdings. An ETN designed to track an index is limited to the fluctuations of the price of the underlying commodity. A sector ETF on the other hand is based on the growth capabilities and stock performance of its energy holdings. It is clear that XLE is more capable of mitigating its downside in a weak environment whilst maximizing returns in a bull market. I believe companies are able to develop strategies that allow for protection from fluctuations in price. An Oil Rally With Brent at 49.15 and WTI at 42.50, some believe the oil market has been dramatically oversold. The argument for an oil rally is essentially this: overly negative sentiment towards a supply gut and geopolitical events (like the Iran deal) has led to an unprecedented market sell off that has driven oil prices to six year lows. Now is the time to capitalize on cheap oil. We are currently in an environment similar to early March, and oil will return to prices closer to 55-60 dollars a barrel (WTI). If you hold to this belief, I recommend choosing an energy ETF that will perform optimally in a variety of environments. The integrated broad market exposure will allow the investor to reduce the risk of betting solely on the performance of the underlying commodity ((oil)). XLE & Two Alternatives Currently I am invested in the Energy Select Sector SPDR ETF (NYSEARCA: XLE ), and I will make the case for XLE in this article. In an effort to provide you with additional high quality options, I will also analyze the Vanguard Energy ETF (NYSEARCA: VDE ) and the iShares U.S. Energy ETF (NYSEARCA: IYE ). There are other energy plays. Some ETFs focus specifically on the E&P side while others have more exposure to global performance. I liked XLE, VDE, and IYE because they are more focused on North American Companies (Exxon (NYSE: XOM ), Chevron (NYSE: CVX ), Etc.) with a global presence in all aspects of the energy market. These ETFs are also have the largest amount of net assets and provide desirable liquidity. Correlation I always mention correlation because you want the ETF to closely track (if not outperform) the underlying index. If it does not do this, then the ETF is likely inefficiently weighted. With long plays, short term correlation is less important, but I will include a graph to show how each ETF performs relative to its index. ^SS1J data by YCharts I compared each ETF to the S&P 500 Equal Weighted Energy Sector Level % change. it is not a perfect correlation, but it does express the close relative grouping of each. Really all I’m looking for here is that each ETF does what it says it will do. Looking closer into 5-year returns, you’ll notice XLE outperformed both VDE and IYE by about 3.5%. Brief Portfolio Composition Look Each ETF is weighted towards each subsector of the broad energy market differently. For this reason, there is variety of tracking error and diversification differentiation. I made an excel sheet to express each sub-sector weighting. Portfolio Composition XLE VDE IYE Integrated Oil and Gas 32% 32% 34% E&P 29% 30% 31% Equipment & Service 17% 16% 17% Pipelines 10% 11% 7% Refiners 10% 8% 7% Drillers, Coal, Etc. 1% 2% 3% Key ETF Metrics I included some key metrics to make a valid comparison. While it does not necessarily dive into weighting or historical returns, it does help narrow down specific areas to think about. XLE VDE IYE Total Assets 11.28 Bil 3.68 Bil 1.19 Bil Avg. Volume 19.9 Mil 456,395 1.1 Mil Expense 0.15% 0.12% 0.45% SEC Yield 2.93% 3.01% 2.28% Turnover Ratio 5.25% 4.00% 7.00% Recommendation All three ETFs are tactical plays that offer exposure to the U.S. energy sector without taking on too much single equity risk. Historically XLE has performed the strongest in most market conditions. I attribute this to XLE’s large net assets and broad exposure (particularly downstream: refiners, pipelines etc.) Storage and Pipelines are not as hurt by excess supply because price reductions are mitigated by increased service demand. XLE has desirable liquidity, and it is extremely cheap (15 Basis points) with a near 3% yield. I believe XLE is the best energy ETF on the market. Disclosure: I am/we are long XLE. (More…) I wrote this article myself, and it expresses my own opinions. I am not receiving compensation for it (other than from Seeking Alpha). I have no business relationship with any company whose stock is mentioned in this article.