Tag Archives: alt-investing

Cornerstone Total Return: Yield Illusion Creates Substantial Downside
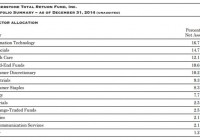
Summary CRF trades at a ~40% premium to NAV. Rich valuation driven by retail investors’ perception of high dividend yield. However, the yield is predominately just a return of investors’ own capital. Background on Closed End Funds A closed-end fund is a publicly traded investment company that raises a fixed amount of capital, and is then structured, listed and traded like a stock on a stock exchange. Whereas conventional mutual funds and ETFs frequently redeem / issue new shares to ensure that the price per share remains in line with the net asset value of the underlying holdings in the funds, this is not the case for CEFs. Rather the share price of CEFs is driven by the market forces of supply and demand, and can at times trade at either large discounts or premiums to NAV of the funds’ actual holdings. This is particularly the case given that the natural investor base for CEFs tends to be small, retail investors that in some cases do not fully understand the products that they are investing in. The Cornerstone Total Return Fund (NYSEMKT: CRF ) is one extreme example, which currently trades at among the most significant premiums to NAV in the CEF universe. Overview of CRF CRF is managed by Cornerstone Advisors, and is composed of a broadly diversified portfolio of stocks, with the largest holdings being some U.S. blue chips. A more comprehensive overview can be viewed in the fund’s annual report : (click to enlarge) (click to enlarge) Source: CRF 2014 Annual Report CRF’s expense ratio (based on 2014 figures) has been just over 1.4% of NAV. Unsustainable Yield Despite the relatively traditional composition of the fund, CRF currently pays a monthly dividend of $0.332 (equating to an annual yield of ~16.6%, or ~23% of the fund’s NAV). You might be asking yourself how this could be possible. The answer is simply that the bulk of the dividend is coming from a return of capital rather than ordinary income/capital gains. In other words, investors are being returned their own money in the fund. (click to enlarge) Source: CRF 2014 Annual Report. Note that per share figures in the table above do not reflect the one-for-four reverse stock split in Dec 2014. Unsurprisingly, the fund’s NAV has declined in turn, as shown in the chart below. (click to enlarge) Source: Yahoo Finance Rich Premium to NAV So now the question is, what do you think is the fair value of this CEF? I certainly wouldn’t pay any premium to NAV for a vanilla portfolio of equities with a ~1.4% expense ratio. Rather, I would prefer to buy a much cheaper ETF like SPY and simply sell part of the holdings each year if I needed the income. But apparently many retail investors disagree (institutional holdings of CRF stand at ~1%, according to Nasdaq), and have been lured in by the siren’s song of this CEF’s “dividend.” In fact CRF is currently trading at a 40% premium to NAV (and has been even higher in some past years). In other words, investors are willing to pay more than $1.40 for each $1 of the fund’s net assets. (click to enlarge) Source: CEF Connect Conclusion Though I hold a small short position in CRF, this is admittedly somewhat speculative given that the fund has in the past traded at any even more extreme premium to NAV, and the borrow cost has been in the mid-single to double digits. However, retail investors should be mindful of the risks that come with owning CEFs trading far above NAV. Disclosure: The author is short CRF. (More…) The author wrote this article themselves, and it expresses their own opinions. The author is not receiving compensation for it (other than from Seeking Alpha). The author has no business relationship with any company whose stock is mentioned in this article.
Rate-Sensitive, Energy-Sensitive Sectors Now Down 10%-Plus

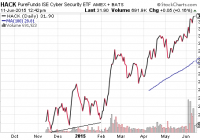
Flashy sub-segments like cyber-security and biotech continue to soar. Yet the belief that U.S. equities can stampede ahead indefinitely is sheer lunacy. Several rate-sensitive areas have already entered 10%-plus correction territory. Bullish borrowers have increased their margin debt to invest in stocks from $445 billion in January to $507 billion today. And why not? The overall price movement for growth sectors of the stock market remains healthy. Flashy sub-segments like cyber-security and biotech continue to soar. For example, I allocated a small portion of moderately aggressive client assets to the PureFunds ISE Cyber Security ETF (NYSEARCA: HACK ) in early February. Its series of higher lows since its inception lent credibility to the notion of adding dollars to the high growth, high reward area. Yet the belief that U.S. equities can stampede ahead indefinitely is sheer lunacy. Consider the reality that exports have been tumbling, labor productivity has been stalling and inventories (supply) have been rising significantly faster than sales demand. No matter how the media spin it, the economy is hurting. Now factor the economic headwinds into current and/or future corporate profits and revenue. What do you get? You come up with some of the highest price-to-sales (P/S), price-to-book (P/B) and price-to-earnings (P/E) ratios in the history of stock market valuation. Who cares, right? “Follow The Fed” advocates argue that global central banks have orchestrated exceptionally easy terms for borrowing, making bonds unattractive and stocks the only place to stash money. They maintain that modest rate increases amount to little more than moving from ultra-accommodating policy to extremely accommodating policy. Still, amateur historians might wish to recount that rate hikes in questionable economic environments (e.g., 1929, 1948, 1980) were met with recessions and stock market bears. Others might want to address the historical truth that the epic collapses of the previous decade (i.e., 2000-2002, 2007-2009) occurred alongside a Fed that had been cutting rates aggressively. Might I be more inclined to yield to a “don’t fight the Fed” reasoning if the 10-year were pushing 1%? I imagine I would be buying the harsh pullback that likely occurred along the way. If the 10-year were hugging 2%? I might expect stocks to hold serve. In contrast, the higher the 10-year climbs due to fears of an imminent tightening campaign, the more likely rate-sensitive stock assets will drag the broader market downward. Remember, the S&P 500 has not witnessed a 10% correction in roughly four years. On the other hand, several rate-sensitive areas have already entered 10%-plus correction territory. Real estate investment trusts in the Vanguard REIT Index ETF (NYSEARCA: VNQ ) are off -11.4%, while utilities in the SPDR S&P Sector Select Utilities have dropped -13.2%. The hardship in the energy arena has been equally challenging. Broad-based energy corporations in the Energy Select Sector SPDR ETF (NYSEARCA: XLE ) may be well off their March lows, but the influential sector fund is still down a bearish -21% from a 2014 pinnacle. Similarly, the JPMorgan Alerian MLP Index ETN (NYSEARCA: AMJ ) – hit by the double whammy of rising yields and price depreciation in crude/natural gas – currently resides in a bear cave with a -21.5% decline. Even the transporters in the iShares Transportation Average ETF (NYSEARCA: IYT ) has witnessed intra-day depreciation of -11.5%; the current price of IYT is also below a long-term 200-day moving average. For the record, I believe the bond rout is closer to running its course than marching forward. There is not much technical support for my belief, other than oversold Relative Strength Index (RSI) indications. Support for the 10-year Treasury in and around 2.5% may even be a decent entry point for government bond investors. Consider the iShares 7-10 Year Treasury Bond ETF (NYSEARCA: IEF ). The U.S. 10-year is trading 10 basis points lower at 2.4% on Thursday. If you had a choice between owning Spain’s 10-year sovereign debt at 2.1%, Germany’s 10-year bund at 0.9%, or the U.S. 10-year at 2.4%, which would you choose? (Note: I recognize that many would choose “None of the Above.” Nevertheless, foreign investors, pension funds and central banks all require government debt; the supply is limited. The dramatic taper tantrum in bonds that occurred in 2013 reversed itself in 2014. Similarly, the bond rout to this point in 2015 is likely to see a sharp reversal in the 2nd half of 2015 or in early 2016.) On the whole, depending on the client, cash levels have been raised to 10%-25%. I have lowered stock and fixed income exposure due to the execution of stop-limit loss orders as well as the elevated correlations across asset classes; the elevated correlations make it particularly difficult to protect portfolios with traditional diversification. In contrast, a tactical asset allocation decision to raise cash makes it possible to acquire shares of stock or bond ETFs at lower prices in the future. Disclosure: Gary Gordon, MS, CFP is the president of Pacific Park Financial, Inc., a Registered Investment Adviser with the SEC. Gary Gordon, Pacific Park Financial, Inc, and/or its clients may hold positions in the ETFs, mutual funds, and/or any investment asset mentioned above. The commentary does not constitute individualized investment advice. The opinions offered herein are not personalized recommendations to buy, sell or hold securities. At times, issuers of exchange-traded products compensate Pacific Park Financial, Inc. or its subsidiaries for advertising at the ETF Expert web site. ETF Expert content is created independently of any advertising relationships.

Highland Capital Launches 3 Hedge Fund Style ETFs

Dallas-based Highland Capital Management is expanding its presence in the ETF world with a focus on alternative investing. Early this year, the issuer filed for 17 alternatives ETFs all targeting four broad hedge funds styles – equity hedge, event driven, macro and relative value. The successful debut of these funds will make Highland one of the largest managers of alternative ETFs in the market. Out of these, Highland Capital recently rolled out a trio of products that aim at giving investors new options in the hedge fund space. The three funds – the Highland HFR Global ETF (NYSEARCA: HHFR ) , the Highland HFR Event-Driven Activist ETF (NYSEARCA: DRVN ) and the Highland HFR Equity Hedge ETF (NYSEARCA: HHDG ) – are designed in collaboration with HFR and are the first of their kind to replicate hedge fund positions in an ETF. The trio provides global hedge fund exposure by investing in equity and debt securities of the U.S. and international companies, charging investors 85 bps in annual fees. The introduction of these ETFs quadrupled the size of Highland Capital’s ETF lineup. HHFR in Focus This ETF seeks to tracks the HFRL Global Index, which uses all the four hedge fund strategies to select the stocks. These strategies may include event-driven, long/short equity, macro, relative-value and other strategies commonly used by hedge fund managers. DRVN in Focus This fund looks to target the stocks of event-driven strategies, which take advantage of transaction announcements and other specific one-time events. The strategy then utilizes an investment process that identifies equity opportunities in companies which are currently engaged in a corporate transaction, such as mergers, restructurings, financial distress, tender offers, shareholder buybacks, debt exchanges, security issuance or other capital structure adjustments. The ETF seeks to track the HFRL Event-Driven Index. HHDG in Focus This fund follows the HFRL Equity Hedge Index, which measures the performance of stocks based only on equity hedge strategies that combine long holdings of equity securities with short sales of stock, stock indices or derivatives related to equity markets. How Do They Fit in a Portfolio? The new products appear interesting choices for investors seeking some smart stock-selection techniques to avoid risks in the market. Hedge-fund replication ETFs have been gaining immense popularity in recent years as these seek to outperform the market over the long term. The funds try to either replicate the investing styles of renowned investors or mimic an index that aims to provide specific hedge fund strategies. This results in a solid and well-diversified portfolio having superior adjusted risk returns. After all, the hedge funds have proven their supremacy by making huge money in any market environment. Competition While there are a number of hedge-fund replication ETFs on the market that use a fund-of-fund approach, there are only a few that use a stock-selection methodology. The ultra-popular the Global X Guru Index ETF (NYSEARCA: GURU ) uses a proprietary methodology to compile the best ideas from a select pool of hedge funds by looking at the 13F document on a quarterly basis. The ETF has AUM of $266 million and expense ratio of 0.75%. The other popular name in this regard is the AlphaClone Alternative Alpha ETF (NYSEARCA: ALFA ) , which has garnered $161.6 million in its asset base while charging 95 bps in fees per year. It uses a proprietary ranking system, ‘Clone Score’, which ranks hedge funds and institutional investors based on the efficacy of replicating their publicity disclosed positions. The IQ ARB Merger Arbitrage ETF (NYSEARCA: MNA ) is an event-driven hedge fund that might give stiff competition to DRVN. This fund offers capital appreciation by investing in global companies for which there has been a public announcement of a takeover by an acquirer yet provides short exposure to global equities as a partial equity market hedge. The product has amassed $130 million in its asset base and charges 75 bps in annual fees. Given that all these products have been able to build up decent assets, it might not be difficult for the Highland products to see solid inflows and garner investor interest given that the interest rate hike might lead to uncertainty and bouts of volatility. Link to the original post on Zacks.com