Tag Archives: alt-investing

Avoiding The Pitfalls Of Factor-Based Investing
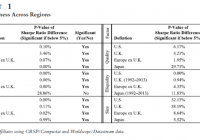
By DailyAlts Staff The proliferation of smart beta ETFs may be a relatively recent phenomenon, but the risk factors used to construct smart-beta indexes – most notably value, momentum, low beta, quality, illiquidity, and size – have been a popular topic for financial researchers for nearly three decades. Building off the early handful of factors, factor-based investing has since been expanded to as many as 250 distinct factors that have allegedly generated historical outperformance, but Research Affiliates’ Jason Hsu, Vitali Kalesnik, and Vivek Viswanathan argue that the supposed outperformance of most (if not all) of these new factors is illusory, based on cherry-picking by researchers and “artifacts” of the data. In fact, Mr. Hsu and his colleagues believe at least one of the traditional factors may be unlikely to generate superior risk-adjusted returns going forward. The researchers make their case in the Summer 2015 edition of The Journal of Index Investing , in an article titled “A Framework for Assessing Factors and Implementing Smart Beta Strategies.” Factor Robustness Hsu, et al. allege that economists, financial researchers, and other quantitative analysts are constantly trying to determine new factors, and that only their positive results are likely to get published. New research undermining an existing and semi-popular factor is unlikely to make it to the stage of peer review, according to Research Affiliates. This means that investors, advisors, and other decision-makers must test would-be factors for robustness themselves. Behind the quantitative data, Hsu, et al. insist that factors must be based on economic intuition and make sense within a theoretical framework – otherwise, they’re likely to be statistical noise. Factor premiums can be based on risk or behavioral issues, but in either case, they should span across geographic markets. If back-testing reveals a factor premium for U.S. stocks, that same premium should be evident in Japan and elsewhere. But when analyzed across geographic regions, only the value and low-beta factors consistently hold up; while momentum, quality, and illiquidity are mixed; and size shows no consistency whatsoever. (click to enlarge) Factor Perturbations Since legitimate factors must make intuitive sense, it stands to reason that they should hold up under “perturbations” of their definitions. For example, the value factor is typically defined with book-to-price ratio, but dividend yield and earnings yield (earnings-to-price) also make sense. Therefore, if the value premium were only evident when measured according to book-to-price, the theoretical framework would crumble. Fortunately for value investors, Research Affiliates’ research indicates that value holds up well under a variety of definitions – as do the momentum, low-beta, and illiquidity factors – but quality and size do not. (click to enlarge) Size Doesn’t Matter? According to Hsu, et al., the small-size factor premium is based on back-testing that includes several months of major small-cap outperformance back in the 1930s, and the factor has not generated alpha since its discovery in the early 1980s. Of course, the 1930s were a time of deflation (strengthening dollar) and the 1980s kicked off a 30-year bull market in bonds (weakening the dollar), which could play a significant role in the data. Today, it is generally assumed that small-cap stocks – with a higher degree of U.S. dollar exposure – benefit from a strong currency. Implementation and Allocation Hsu, et al.’s paper looks into implementation and allocation issues, as well, and notes that transaction costs are rarely taken into account by factor-based investors – and this is a mistake. To maximize risk-adjusted returns, factor-based investors should rotate their portfolios only as often as is necessary to capture the factor premium, and no more. The authors say that factor allocation faces many of the same challenges as asset allocation, and that smart-beta solutions should be customized to meet individual investors’ unique risk tolerances. For more information, visit researchaffiliates.com to download a pdf copy of the paper .

Inside The Germany ETF Sell-Off

Germany ETFs had a stellar start to this year but failed to hold on to those gains. The key German gauge DAX index entered the correction phase starting this week and retreated over 10% from April. This led the European stocks to log their most stretched-out spell of sell-offs this year, per Bloomberg . In any case, corrections in German equities were in arrears after a prolonged bull run due to the launch of the QE measure by the ECB. Even after the steep sell-off, the Deutsche X-trackers MSCI Germany Hedged Equity ETF (NYSEARCA: DBGR ) , the best performer in the Germany equities ETF space from a year-to-date look, returned over 11.5%. Also, the nagging Greek debt deal also brought trouble for the German assets. Wobbly investors are now focusing more on profit booking before anything worse happens to the fate of the common currency Euro. Though such chances are low, little progress in the Monday meeting over Greece’s bailout program sent shockwaves to investors. Greece has held up its debt payments of 303.3 million euros to the International Monetary Fund (NYSE: IMF ), which was due on June 5. Instead, the IMF chief spokesman said that Greece plans “to bundle the country’s four June payments into one, which is now due on June 30.” In the meantime, Greece’s creditors have proposed for stricter austerities like pension cuts, tax increases and other policies (which need to be put into practice by Athens) in return for a bailout program until the end of March 2016. A conflict between Athens and its creditors will find a compulsory retreat of Greece from the Euro zone which in turn will see other Euro zone countries from Malta to Greece’s biggest creditor – Germany – in dire straits. Among the major losers, DBGR, the iShares Currency Hedged MSCI Germany ETF (NYSEARCA: HEWG ) , the WisdomTree Germany Hedged Equity ETF (NASDAQ: DXGE ) and the iShares MSCI Germany Small Cap Index ETF (BATS: EWGS ) deserve special mention. While DBGR lost the maximum by 3.50%, HEWG was off 3.49%, DXGE lost 3.36% and EWGS retreated 2.76% in the last one week (as of June 9, 2015). The situation was no different in the German fixed income market either. The yield on 10-year German government bonds rose to 1%, which is almost a nine-month high. Investors should note that the same bond yields were almost zero percent only a few days back. Reduced fears of deflation in the Euro zone might have led the bondholders to ask for higher yields. Notably, the Euro zone recorded a six-month high inflation in May at 0.3% . So, a spike in yield is somewhat self explanatory. This, along with Greek worries led to the anxiety in the market. Over the last five trading sessions (as of June 9, 2015), the PowerShares DB German Bund Futures ETN (NYSEARCA: BUNL ) lost 3.2% and is down over 4.6% year to date. Link to the original post on Zacks.com

Trying To Hedge 7-10 Bond Yields? Consider TBX

Summary TBX provides a well correlated hedge for intermediate treasury bonds. TBX is associated with significant risks and is intended for achieving short term goals. Recommended for investors who believe interest rates will rise dramatically over an intermediate time frame. Basic Information The ProShares Short 7-10 Year Treasury ETF (NYSEARCA: TBX ) is a n exchange traded note (ETN). ETN’s are unsecured, unsubordinated debt securities. This type of debt security differs from other types of bonds and notes because ETN returns are based upon the performance of a market index minus applicable fees, no period coupon payments are distributed and no principal protections exist. TBX is intended to move inversely (-1x) to the 7-10 year Barclay’s Bond Index. The Barclay’s Bond Index is tied to U.S. treasury yields. TBX seeks investment results for a single day only, not for longer periods. A “single day” is measured from the time the Fund calculates its net asset value (“NAV”) to the time of the Fund’s next NAV calculation. The return of the Fund for periods longer than a single day will be the result of each day’s returns compounded over the period, which will very likely differ from the inverse (-1x) of the return of the Barclays U.S. 7-10 Year Treasury Bond Index (the “Index”) for that period. For periods longer than a single day, the Fund will lose money when the level of the Index is flat, and it is possible that the Fund will lose money even if the level of the Index falls. Longer holding periods, higher index volatility, and inverse exposure each exacerbate the impact of compounding on an investor’s returns. During periods of higher Index volatility, the volatility of the Index may affect the Fund’s return as much as or more than the return of the Index. Expense Ratio: .95% + Portfolio turnover (currently 0% because cash instrument and derivative transactions are not included). How Could it be used? If you are looking for a 10-year hedge, TBX could be a very good play. It is highly correlated to the market and is a useful tool for any skilled investor. I cover a multitude of reasons in this article to illuminate the risks of investing in an ETN, but with adequate forethought TBX is not a bad strategy, especially with the threat of rising interest rates. Principal Investment Strategy All investment strategies are used in combination to achieve similar daily return characteristics as -1x of the index: Derivatives – financial instruments whose value is derived from the value of an underlying asset or assets, such as stocks, bond, funds, interest rates, or indexes. Swap agreements – Contracts entered into primarily with major global financial institutions for a specified period ranging from a day to more than one year. In a standard “swap” transaction, two parties agree to exchange the return (or differentials in rates of return) earned or realized on particular predetermined investments or instruments. The gross return to be exchanged or “swapped” between the parties is calculated with respect to a “notional amount,” e.g., the return on or change in value of a particular dollar amount invested in a “basket” of securities or an ETF representing a particular index. Futures Contracts – Standardized contracts traded on, or subject to the rules of, an exchange that call for the future delivery of a specified quantity and type of asset at a specified time and place or, alternatively, may call for cash settlement. Money Market Instruments U.S. Treasury Bills – that have maturities of one year or less and supported by full faith and credit of the U.S. government. Repurchase Agreements – Contracts in which a seller of securities, usually U.S. government securities or other money market instruments, agrees to buy them back at a specified time and price. Repurchase agreements are primarily used by the Fund as a short-term investment vehicle for cash positions. These are the Principal Risks associated with TBX Risks Associated with the Use of Derivatives Compounding Risk Correlation Risk Fixed Income and Market Risk Counterparty Risk Debt Instrument Risk Interest Rate Risk Intraday Price Performance Risk Inverse Correlation Risk Liquidity Risk Early Close/Late Close/Trading Halt Risk Market Price Variance Risk Valuation Risk Non-Diversification Risk Portfolio Turnover Risk Short Sale Exposure Risk As you can see below, estimated returns are volatile, and the funds actual results may be significantly better or worse than the underlying index. Bolded values, not including the x and y axis percentages, are where the fund performed worse than expected. This is meant to illuminate the possibility of under or over performance. Estimated Fund Returns Index Performance One Year Volatility Rate One Year Index Inverse (-1x) of the One Year Index 10% 25% 50% 75% 100% -60% 60% 147.50% 134.90 94.70 42.40 (8.00) -50% 50% 98.00 87.90 55.80 14.00 (26.40) -40% 40% 65.00 56.60 29.80 (5.00) (38.70) -30% 30% 41.40 34.20 11.30 (18.60) (47.40) -20% 20% 23.80 17.40 (2.60) (28.80) (54.00) -10% 10% 10.00 4.40 (13.50) (36.70) (59.10) 0% 0% (1.00) (6.10) (22.10) (43.00) (63.20) 10% -10% (10.00) (14.60) (29.20) (48.20) (66.60) 20% -20% (17.50) (21.70) (35.10) (52.50) (69.30) 30% -30% (13.80) (27.70) (10.10) (56.20) (71.70) 40% -40% (29.30) (32.90) (44.40) (59.30) (73.70) 50% -50% (34.00) (37.40) (48.10) (62.00) (75.50) 60% -60% (38.10) (41.30) (51.30) (64.40) (77.00) Correlation to 7-10 year yields I aligned TBX with its foil the iShares 7-10 Year Treasury Bond ETF ( IEF). IEF seeks to track the investment results of an index composed of U.S. Treasury bonds with maturities between seven and ten years. IEF is comprised entirely of intermediate government bonds. It is essentially perfectly correlated to the Barclays U.S. 7-10 Year Treasury Bond Index. If IEF moving up in value it is likely overall interest rates are falling due to the nature of the bond. If IEF is moving down in value it is likely overall interest rates are rising. Due to the inverse relationship of IEF and TBX, TBX provides a hedge for 7-10 year bonds. Conclusion If you are trying to hedge your investment on intermediate treasury yields then TBX is probably an ETN you ought to consider. However, it is important for any smart investor to weigh the risks associated with any ETN before jumping into any investment long or short. Disclosure: The author has no positions in any stocks mentioned, and no plans to initiate any positions within the next 72 hours. (More…) The author wrote this article themselves, and it expresses their own opinions. The author is not receiving compensation for it (other than from Seeking Alpha). The author has no business relationship with any company whose stock is mentioned in this article.