Investors – Your Hair Is Not On Fire, You Don’t Have To Get Out Of The Market
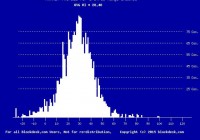
Summary The media woods (including Seeking Alpha) are full of dire predictions of market corrections, retrenchment, collapse, from anticipated Fed interest rate hikes, Greek intransigence in the EU, Putin’s Ukranian grab. Oh, woe! It’s all bad. ISIS amok. Massive panicked African emigration to Europe. Police stations and bible study groups becoming shooting ranges. Our own government and AT&T telling lies. Wouldn’t you think folks who help big-$-fund Portfolio Managers realign their holdings would see a market decline coming? But they sure don’t behave like they believe it’s so. What’s the matter with them? Or is it with us? Rational Behavior under threats The normal actions of informed humans sensing impending danger is to erect defenses and plan strategies to deflect or overcome attacks. That is what market-makers [MMs] do in their ordinary course of moving a large part of a trillion dollars of equity investments each day from one set of hands to another. To get balance between buyers and sellers where volume transactions in stocks involve tens and hundreds of $-millions, the MMs usually have to put firm capital at risk temporarily. Hundreds of times a day, every day. They are no strangers to risks and threats. They are highly skilled practitioners of hedging and arbitrage. Those art forms are integral to their enviable successful progress in protecting their capital from harm. So what are they doing to protect against market declines? Nothing out of the ordinary. Just what they have been doing, day-in and day-out. That includes world-wide watching, listening, questioning, reporting, recording, evaluating, communicating. It’s strange that organizations so well resourced and disciplined would miss the threats that so many others claim to be about to harm all of us. Yet MMs continue to behave in the same manner, hedge to the same degree, pay for protection about the same amounts, in deals structured the same way as they have been, over many past months. We have been watching their behavior for decades They clearly behave quite rationally, rather systematically, given what they know at various times. In our recent SA article of “Worry, worry, worry” we demonstrated the differences present as they sense impending problems or ongoing good times. Our behavioral analysis of their hedging practices daily has not changed over decades. It shows the asymmetry of their price change expectations for 3,000 or more stocks day after day. For each stock we produce what they must think their serious, powerful clients are likely to do to the prices of stocks the clients want to own in the future, and to ones they no longer want to own. And to the price points where the clients might change their minds. The ranges of possible price prospects get described by a single simple measure, the Range Index. Its job is to tell the balance between upside price change potentials and downside price change exposures. Each stock, ETF, or equity market index has a Range Index [RI] whose number tells what percentage proportion of that subject’s likely coming price range lies below its current market quote. A low RI suggests limited downside, ample upside. So the RI becomes a common denominator for price expectations, a very useful yardstick to compare the expectations of many varied issues. And, in the aggregate, to have a sense of what the market outlook overall might be. That’s what is shown at various stages of market price change anticipations in the “Worry, worry, worry” article. Figure 1 updates that distribution of informed professional expectations to last night. Figure 1 (click to enlarge) (used with permission) The average Range Index of the 2,500+ names covered in this picture is 28, meaning that the typical stock has better than twice as much upside as downside. A 50 RI would make the odds of up vs. down a coin-flip. How many in Figure 1 have that kind of prospect, or worse (a higher RI than 50)? A negative RI means that the subject’s current price is lower than the bottom of the price range regarded as likely or justifiable. That condition sounds like “cheap” to many Graham & Dodd folks. Figure 2 tells what has happened to stock, ETF, and market index prices in the 16 weeks following the daily observation of Range Indexes for this population during the past 4-5 years. Some 2,959,450 observations built this display. Figure 2 (click to enlarge) That 1 : 1 blue row of Figure 2 is the overall population average, positioned at the 50 RI level. That’s where up and down price change prospects are held equally likely. The green rows above are of progressively lower Range Index (or cheaper) forecasts, and the red rows below the blue row are of progressively more expensive RIs. The maroon-count row just above the blue row is coincident with today’s population average. But we should be more interested in what can be done to improve an existing investment portfolio than in speculating about what might happen to the market as a whole. Play the game better What is of interest to active investment managers is the potential payoffs and odds for success in buys of those stock or ETF RI forecasts up in the top rows of the table. And what might best be purged from a portfolio where the holding’s RI is among those below the 50 blue-row level – higher RIs than 50. For perspective, take a look back at Figure 1. Today, just as in most daily experiences, there are many promising prospects for purchase off to the left in the Figure 1 distribution. To the extent that these have proven to be reliable, credible forecasts, then it is likely that what happens to the market as a whole has little impact on their near-term future. And it is their near-term future that active investors should be concerned with. In today’s global, high-tech, communicative and competitive networks of business activity, reaching out with forecasts as much as a year or more is not investing, it is just speculating. While overall-market forecasters are speculating as to where the averages will be a year or more from now, active investors will have the opportunity to have capitalized on interim opportunities, compounding their triumphs (often 3-4 times in a year) net of their mistakes (typically 1 in 2 years) to produce rates of gain that may be multiples of what the market averages may have produced in capital gains. Those kinds of odds, 6 out of 8, or 7 out of 8 wins in two years for each allocation of capital, are quite doable when good guidance is provided. Usually the rates of gain in the wins are well above those of the market, and the effect of compounding can multiply the progress in wealth-building well beyond the (now highly competitive and economical) transaction costs or infrequent loss. As an example, using market-maker forecasts to compare over 2,500 equities daily, and ranking them based on how well prior forecasts similar to the current-day forecast have performed, over 1900 opportunities have been identified so far in this 2015 year at a rate of 20 a day. Following a time-efficient discipline standard of portfolio management to all, of the closed out positions (more than half) the average annualized rate of net gains are +31%, compared to that of SPY at +5.1%. Conclusion There are nearly always attractive stocks or ETFs to buy, regardless of overall market prospect appearances. The diversity of opportunities among over 3,000 potential quality portfolio investment candidates provides a rich field of perpetually price-renewed prospects. But investors need to have a portfolio management strategy and discipline urging them to be frequently aware of developing opportunities and maturing prior actions in need of reinvesting. This is called active investing, and will involve more attention and time commitment than many investors are willing or need (the most fortunately capitalized) to make. The rewards for active investing are demonstrably far better than most investors of all types have been led to believe. Those investors faced with impending capital-requirements having fixed time deadlines may find that the only way now that will satisfy their needs makes adoption of active investing a most sensible practice. Disclosure: I/we have no positions in any stocks mentioned, and no plans to initiate any positions within the next 72 hours. (More…) I wrote this article myself, and it expresses my own opinions. I am not receiving compensation for it (other than from Seeking Alpha). I have no business relationship with any company whose stock is mentioned in this article.