Tag Archives: alt-investing

5 Ways To Beat The Market: Part-3 Revisited
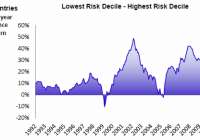
In a series of articles in December 2014, I highlighted five buy-and-hold strategies that have historically outperformed the S&P 500 (SPY). Stock ownership by U.S. households is low and falling even as the barriers to entering the market have been greatly reduced. Investors should understand simple and easy to implement strategies that have been shown to outperform the market over long time intervals. The third of five strategies I will revisit in this series of articles is the “low volatility anomaly” which has seen lower volatility stocks produce higher risk-adjusted returns over time. In a series of articles in December 2014, I demonstrated five buy-and-hold strategies – size, value, low volatility, dividend growth, and equal weighting, that have historically outperformed the S&P 500 (NYSEARCA: SPY ). I covered an update to the size factor published on Wednesday , and posted an update to the value factor on Thursday. In that series, I demonstrated that while technological barriers and costs to market access have been falling, the number of households that own stocks in non-retirement accounts has been falling as well. Less that 14% of U.S. households directly own stocks, which is less than half of the amount of households that own dogs or cats , and less than half of the proportion of households that own guns . The percentage of households that directly own stocks is even less than the percentage of households that have Netflix or Hulu . The strategies I discussed in this series are low cost ways of getting broadly diversified domestic equity exposure with factor tilts that have generated long-run structural alpha. I want to keep these investor topics in front of the Seeking Alpha readership, so I will re-visit these principles with a discussion of the first half returns of these strategies in a series of five articles over the next five days. Reprisals of these articles will allow me to continually update the long-run returns of these strategies for the readership. Without further ado, one of my favorite and most oft discussed strategies on Seeking Alpha… Low Volatility Since the groundwork behind the Modern Portfolio Theory was laid fifty years ago, it has been axiomatic that riskier portfolios should expect to be compensated with higher returns. More recent academic research has shown that this assumption holds less well at the extremes – the least risky stocks tend to outperform the most risky stocks on both a risk-adjusted and an absolute basis. In a 2012 paper by Nardin L. Baker of Guggenheim Investments and Robert A. Haugen of Haugen Custom Financial Systems entitled: ” Low Risk Stocks Outperform Within All Observable Markets of the World “, the pair demonstrated that in their thirty-three country sample the highest risk decile of stocks, rebalanced monthly, underperformed the lowest risk decile of stocks in each locale. Source: Nardin & Baker (2012) In 2013, Andrea Frazzini, David Kabiller, and Lasse Pedersen, each affiliated with hedge fund AQR Capital Management, published ” Buffett’s Alpha “, which deconstructed the return profile of Berkshire Hathaway ( BRK.A , BRK.B ). In “Buffett’s Alpha”, the authors determined that the public stocks owned by Buffett in 13F filings had only a market beta of 0.77 from 1980-2011. Over that thirty-one year period, Buffett outperformed the market while owning in the public portion of his portfolio securities which on average had only three-quarters of the market beta. At the 1999 Berkshire Hathaway Annual Meeting, Buffett, during the rising crescendo of the tech bubble stated: “We’re more comfortable in that kind of (traditional) business. It means we miss a lot of very big winners. But we wouldn’t know how to pick them out anyway. It also means we have very few big losers – and that’s quite helpful over time. We’re perfectly willing to trade away a big payoff for a certain payoff.” From the chart above by Haugen and Baker, the end of the 1990s was the period when the most volatile stocks were actually outperforming the least volatile stocks as earnings multiples for start-ups in the tech space reached stratospheric heights. Buffett, as his 1999 quote illustrates, chose to pass and his relative performance in the short-run faltered, but over the long run he avoided the tech bubble-fueled market meltdown. Missing these major market corrections has been a predominant source of Buffett’s sustainable alpha. This is consistent with the return profile for the low volatility strategy as seen in the cumulative graph of the S&P 500 Low Volatility Index versus the S&P 500 below. Low volatility stocks underperformed during the run-up to the tech bubble, but strongly outperformed in the aftermath and through the financial crisis. (click to enlarge) Source: Standard and Poor’s; Bloomberg Buffett has historically been called a “value investor”, but as we saw in my second article in this series, while value investing produces higher long-run returns, it also has higher variability of returns. The AQR researchers saw low volatility investing and leverage as key to Buffett’s success, and I have chosen to discuss them in this series as separate, but related strategies. From an analytic standpoint, the correlation coefficient of the S&P Pure Value Index and the S&P Low Volatility Index has been roughly equivalent to the correlation between the S&P 600 Smallcap Index ( covered in my first article in this series ) and low volatility stocks, and few would argue that the latter pair has exposure to similar risk factors. Certainly, Buffett’s ability to miss the bursting of the tech bubble was highly correlated with the return series for low volatility stocks above. If we can take a subset of the broader market, low volatility stocks, and demonstrate that they have outperformed, then another segment of the market must be underperforming. Over the twenty-year plus time period we are examining, high beta stocks have fit that mold, and that underperformance is captured in the graph of the cumulative returns of low volatility stocks and high beta stocks below: (click to enlarge) Source: Standard and Poor’s; Bloomberg Two of the three authors of “Buffett’s Alpha”, Andrea Frazzini and Lasse Heje Pederson also collaborated on ” Betting Against Beta ” where the researchers demonstrate that since leverage constrained investors bid up high-beta assets, that high beta is necessarily associated with lower alpha. The articles demonstrates the underperformance of high beta across more than 20 global equity markets and several fixed income markets. This analysis makes intuitive sense. Long-only active managers who are benchmarked against an index naturally seek higher beta assets as a means to outperformance, but the cumulative effect of this preference for riskier assets lowers their expected forward returns as compared to disfavored lower beta stocks. Behavioral explanations including lottery preferences, representativeness, and overconfidence have also been suggested for the relative underperformance of high volatility stocks. The S&P 500 Low Volatility Index is replicated through the exchange traded fund, Powershares S&P 500 Low Volatility Portfolio (NYSEARCA: SPLV ), which carries a 0.25% expense ratio. The raw beta of this fund over the trailing 1-year is just 0.84, which compares reasonably to the historical beta that Buffett had realized in the aforementioned study. My favorite part of this low volatility strategy for buy-and-hold investors with a long-term horizon is that the strategy has outperformed when the stock market has been falling, besting the broader market in 2000-2002 and 2008. The low volatility strategy underperformed the most in 1998 and 1999 as tech multiples ballooned and Buffett was forced to defend his underperformance, but the strategy far outpaced the broader market in the 2000-2002 correction. While low volatility stocks have historically outperformed the broader market, they lagged in the first half of 2015. Part of this underperformance mirrors the weak relative performance by low volatility stocks during the rate-related selloff in 1994 (see first half returns below). As the rate selloff in 2015 has reversed in the very early days of the second half of the year, low volatility stocks have outperformed the broader market by nearly 2%, quickly erasing over half of their year-to-date deficit. While the Low Volatility Index will be more sensitive to higher interest rates than other segments of the equity market, I continue to expect that low volatility stocks will continue to offer attractive risk-adjusted returns over the business cycle. As I wrote in my 10 Themes Shaping Markets in the Back Half of 2015 , stretched equity multiples domestically will necessitate that valuations be driven by changes in earnings, tempering further price gains. As equity prices rise, investors may look to opportunistically rotate into underperforming rate-sensitive assets and lower volatility assets. Given the tendency for lower volatility assets to outperform in falling markets, investors may desire to rotate to lower volatility stocks which have underperformed in 2015. I will be publishing updated results for two additional proven buy-and-hold strategies that can be replicated through low cost indices over the next couple of days. Disclaimer My articles may contain statements and projections that are forward-looking in nature, and therefore inherently subject to numerous risks, uncertainties and assumptions. While my articles focus on generating long-term risk-adjusted returns, investment decisions necessarily involve the risk of loss of principal. Individual investor circumstances vary significantly, and information gleaned from my articles should be applied to your own unique investment situation, objectives, risk tolerance, and investment horizon. Disclosure: I am/we are long SPY, SPLV. (More…) I wrote this article myself, and it expresses my own opinions. I am not receiving compensation for it (other than from Seeking Alpha). I have no business relationship with any company whose stock is mentioned in this article.
Stocks Are Not Milk – So Don’t Invest Like They Are

I want to warn you about stock splits today – and to save you from getting bamboozled the next time a company splits its stock, like Netflix (NASDAQ: NFLX ) is scheduled to do next week. If you have ever gone grocery shopping, you might think you have a good understanding of stock splits. For example, I’m sure you have noticed that four one-quart containers of milk will cost you more than a one-gallon container. The milk company is able to create value by dividing the original gallon into smaller containers. But what works in the supermarket does not work on the stock market, despite the fact that many investors behave as if they believe it does. They become elated when they hear that a stock they own is about to split, because, like in our milk example, they believe that the sum of the parts will be worth more than the whole. Or they decide to buy into a stock because it is going to split, believing, again, that four quarts is worth more than one gallon. I have always found this behavior curious. After all, what’s the difference between owning 100 shares of a $100 stock and 200 shares of a $50 stock? There is no difference. Your total investment is worth $10,000 either way. The only reason to think otherwise would be if you believed that a stock would appreciate at a faster rate after a split than it would have without a split. However, there is no evidence to support this line of thinking. When managements are asked why they split their stock, they inevitably say that the price of the stock had gone up too high, making it unaffordable for many investors. By saying this, they are implying that there would be greater demand for the stock if only the price were lower. Those of us who studied Economics 101 would agree that for most goods, there is a relationship between price and demand. In general, the lower the price, the greater the demand. However, stocks are not like milk. You can’t create value out of stocks simply by dividing them into smaller units. A stock split changes the price per share, but it does not change the price of all the shares in aggregate. In other words, a stock split has no impact on the company’s market capitalization. If the company were in play, do you really believe the acquirer would pay a larger premium simply because the target split the stock? Of course not. Having said that, I must admit that there are times when stock splits make sense. For example, several decades ago, before there were discount brokerage firms, trading costs were extremely high. Furthermore, investors paid a penalty if they bought (or sold) less than a round lot (i.e., 100 shares). As a result, there was a significant monetary incentive to trade at least 100 shares at a time. That’s no longer the case. Trading commissions have been driven down significantly. If you can’t afford to buy 100 shares of a $1,000 per share stock, there is nothing preventing you from buying 50 shares or even 10 shares. For that reason alone, there is much less of a need for corporations to split stock. So are there any good reasons for a company to split stock these days? Sure. A stock split would make sense if the stock price were so high that even one share were unaffordable. Berkshire Hathaway Class A (NYSE: BRK.A ) shares sell for more than $200,000 each. There aren’t many investors who can afford that. It would certainly make sense for Berkshire to split the stock. The problem is that Warren Buffett, the chairman and CEO, vowed long ago to never split the shares. Yet, at one point, he realized he had a problem. So in order to avoid breaking his vow, he simply created a new “Class B” (NYSE: BRK.B ) type of share. For all intents and purposes, the creation of the Class B shares was equivalent to splitting the stock. Here’s another good reason for a split. Apple (NASDAQ: AAPL ) initiated a 7-for-1 stock split in June 2014, when the stock price was near $700 per share. That’s nowhere near Berkshire territory. Most investors could easily afford to buy 10 or even 20 shares of a $700 stock – so why the split? The answer became clear a few months after the split, when Apple was added to the Dow Jones Industrial Average. Unlike most market indexes, the Dow is not capitalization-weighted. It is price-weighted. In other words, the higher the price, the greater the impact on the index. There was no way the folks at Dow Jones were going to include a $700 stock in the index. By splitting the stock, Apple brought the stock price down to a level that was comparable to several of the Dow’s other components. The split made Apple eligible for membership in one of the most prestigious market indexes. Finally, there is one other valid reason why companies might want to split their stock. A stock split can be an effective way for management to signal its optimism to the market. It’s one thing for the CEO to state that he or she is bullish about the company’s prospects. It’s a completely different thing to actually signal that optimism by splitting the stock. In this case, a stock split is like putting your money where your mouth is. Management would not be likely to initiate a split if it thought the company was about to run into a rough patch. Here’s my advice on stock splits. Don’t buy a stock just because the company announces a split. A split might cause a brief rally, but there are more important factors that will have a stronger impact on the stock price over the long term. Perhaps this is best exemplified by recent events at Netflix. The company announced a 7-for-1 stock split right after the market closed on June 23. Not surprisingly, the immediate reaction was euphoric. The stock surged significantly higher in after-hours trading. Yet, by the end of the following day, shares of Netflix were trading lower, and they have continued to drift lower ever since. It turns out that Carl Icahn had liquidated his entire position in the company, suggesting he thought the shares were no longer undervalued. That’s more important than how many quarts are in a gallon.

YLCO – Leveraging On The Growth Of The YieldCo Investment Class

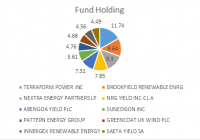
Summary YieldCos are an emerging asset class of yield vehicles, providing stable and growing dividend income from renewable energy assets. The ETF portfolio consists of high quality yieldco securities. The Global X YieldCo Index ETF is a low risk way to play the high growth renewable energy. The Global X YieldCo Index ETF (NASDAQ: YLCO ) is a new ETF investing in yieldcos as the underlying asset. It was formed by the Global X Funds, one of the largest issuers of ETFs providing investment opportunities across the global markets. This ETF provides a good opportunity for investors looking to invest in the renewable energy sector including solar and wind companies. YieldCos are becoming important especially in the solar industry. Many big solar companies have made plans to form a yieldco. YieldCos are dividend growth oriented public companies, providing stable cash flows and distributing the cash amongst its shareholders as dividends. YLCO will be the first YieldCo ETF available to U.S. investors. ETF Details The fund started on May 27, 2015 and has an expense ratio of 0.65%. The ETF follows the Indxx Global YieldCo Index, which is the underlying index. It will have to invest at least 80% of its total assets in the securities of the underlying index. It follows a replication strategy, where investment in securities will be done in the same proportion as the underlying asset; not trying to outperform or underperform. Since the Global YieldCo Index focuses on the energy sector, the new ETF will also concentrate on the energy sector. The Global YieldCo Index currently has a yield of over 3%. This fund is different from the rest as it seeks to invest in yieldcos. Why should you invest in a Renewable Energy YieldCo 1) Renewable Energy is growing rapidly Renewable energy usage has been scaling up in recent times. With solar energy reaching grid parity in a number of places, it is now becoming more economical to use solar power rather fossil fuels. Countries are focusing on reducing their carbon footprint by using more renewable energy. Developing countries like China and India have made aggressive plans to shift their energy mix from coal to more cleaner and efficient energy sources like wind and solar. Energy companies are bound to benefit in the future from these long term trends. According to Solar PV roadmap by IEA, solar energy capacity will grow to 3000 GW by 2050 up from 184 GW now. 2) YieldCos are becoming popular YieldCos are fast gaining traction in the renewable energy space. It is created by a parent company to lower the cost of capital, as renewable energy projects are capital intensive. Green energy does not require fuel and most of the cost is front loaded. The capital cost is the most crucial variable in determining the levelized cost of electricity (LCOE). The income from these yieldcos is considered reliable and some of the yieldcos are also growing rapidly e.g. Terraform Power (NASDAQ: TERP ). YieldCos distribute the cash amongst investors in the form of dividends. YieldCos have become extremely popular in this industry today. They enter into long term contracts and thus provide stable cash flows. This industry currently has a combined market capitalization value of $39 billion currently and 11 more IPOs are in the pipeline. 3) Top 10 Fund Holding The fund holds 20 securities with the top holding Terraform Power Inc. accounting for as much as 12%. TERP was the first yieldco formed by SunEdison (NYSE: SUNE ) in the solar energy space, which revolutionized the whole industry. The company’s portfolio has grown from 808 MW since its IPO in July 2014 to 1,675 MW. It has plans to diversify into natural gas, geothermal and hydro power. The CAFD guidance more than doubled to $225 million for 2015 . Another big holding is Brookfield Renewable Energy Partners which owns $20 billion in renewable power assets and is a leading operator of renewable projects across North America, Latin America and Europe. It has installed more than 7GW capacity predominantly in the hydroelectric space. The 3rd largest holding is NextEra Energy Partners (NYSE: NEP ) which owns clean energy projects particularly wind and solar energy in North America with stable, long-term cash flows. It declared $100-120 million as its CAFD guidance for 2015 and is expecting a 12-15% annual growth in dividend distribution over the next five years. Data from Global X Funds 4) Geographic Diversification Though the fund has a global footprint, the focus in mainly on the developed countries. The main reason for this concentration is the fact that yieldcos have been launched mainly in these regions. Emerging markets do not have major yieldcos as of now. As time passes, I expect yieldcos to emerge in the developing markets as well. Data from Global X Funds Index Characteristics (click to enlarge) Source: Indxx Risks One of the concerns of investing in this ETF could be the fact that the underlying assets are not fully under the control of its management. They are dependent on their sponsors. For example, if the sponsors do not have a healthy project pipeline, they will be unable to transfer the assets to their underlying yieldco which may adversely affect the yieldco’s performance and in turn the ETF’s. Other than this, it is a relatively new concept in the industry and like any other new venture there is this risk of whether it will be a success or a failure. But given the high quality stocks in the Global X YieldCo portfolio, I do not think it should be a major concern. Stock performance The Global X YieldCo Index ETF was launched on May 27, 2015 at $15.35 and is currently trading at ~$15. Conclusion Investing in renewable energy stocks is sometimes regarded as risky given the volatile nature of the sector. ETFs are a good way to diversify individual stock risks and are regarded as less risky. The Global X YieldCo Index ETF is a good and balanced way to stay invested in the green space, giving exposure to the growing yieldco market. It is a relatively new concept in the market now and has been launched by one of the fastest growing issuers of ETFs. I think it’s a smart way of investing in the renewable energy space as it is less risky and involves a portfolio of growing stocks. Disclosure: I/we have no positions in any stocks mentioned, and no plans to initiate any positions within the next 72 hours. (More…) I wrote this article myself, and it expresses my own opinions. I am not receiving compensation for it (other than from Seeking Alpha). I have no business relationship with any company whose stock is mentioned in this article.