Tag Archives: alt-investing

Global Equities Bounce; Still Oversold

At last Wednesday’s close, global markets had pretty much all reached extreme oversold territory. Below is a snapshot of where things stand after the rally we’ve seen over the last three trading days. The screen below shows the 30 largest country ETFs traded on US exchanges. The dot represents where the ETF is currently trading within its range, while the tail end represents where it was trading one week ago. The black vertical “N” line represents each ETF’s 50-day moving average, and moves into the red or green zones are considered overbought or oversold. We’ve also included both the 3-day change and year-to-date change for each ETF. Even after the huge bounce we’ve seen, nearly half of the countries shown remain slightly oversold, and none of the countries that have bounced have moved back above their 50-day moving averages. The 50-DMA is the next resistance level for most of these ETFs to clear, so we’ll be watching closely this week to see if the resistance can be broken. Share this article with a colleague

Dual Momentum July Update

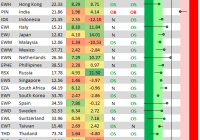
Scott’s Investments provides a free ” Dual ETF Momentum ” spreadsheet, which was originally created in February 2013. The strategy was inspired by a paper written by Gary Antonacci and available on Optimal Momentum . Antonacci’s book, ” Dual Momentum Investing: An Innovative Strategy for Higher Returns with Lower Risk “, also details Dual Momentum as a total portfolio strategy. My Dual ETF Momentum spreadsheet is available here , and the objective is to track four pairs of ETFs and provide an “Invested” signal for the ETF in each pair with the highest relative momentum. Invested signals also require positive absolute momentum, hence the term “Dual Momentum”. Relative momentum is gauged by the 12-month total returns of each ETF. The 12-month total returns of each ETF is also compared to a short-term Treasury ETF (a “cash” filter) in the form of the iShares Barclays 1-3 Treasury Bond ETF (NYSEARCA: SHY ). In order to have an “Invested” signal, the ETF with the highest relative strength must also have 12-month total returns greater than the 12-month total returns of SHY. This is the absolute momentum filter, which is detailed in depth by Antonacci, and has historically helped increase risk-adjusted returns. An “average” return signal for each ETF is also available on the spreadsheet. The concept is the same as the 12-month relative momentum. However, the “average” return signal uses the average of the past 3-, 6-, and 12- (“3/6/12”) month total returns for each ETF. The “invested” signal is based on the ETF with the highest relative momentum for the past 3, 6, and 12 months. The ETF with the highest average relative strength must also have an average 3/6/12 total returns greater than the 3/6/12 total returns of the cash ETF. Portfolio123 was used to test a similar strategy using the same portfolios and combined momentum score (“3/6/12”). The test results were posted in the 2013 Year in Review and the January 2015 Update. Below are the four portfolios along with current signals: (click to enlarge) As an added bonus, the spreadsheet also has four additional sheets using a dual momentum strategy with broker-specific commission-free ETFs for TD Ameritrade, Charles Schwab, Fidelity, and Vanguard. It is important to note that each broker may have additional trade restrictions, and the terms of their commission-free ETFs could change in the future. Disclosures: None Share this article with a colleague
Reaves Utility Income Fund: Monthly Payout Currently Offering A 6% Yield

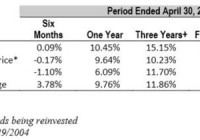
Summary Reaves Utility Income Fund is a CEF that invests in a broad range of utilities. Reaves is selling at a discount to NAV and offers a relatively safe 6% monthly yield. Reaves is not likely to outperform of underperform the utility indexes. About a year ago someone offered Reaves Utility Income Fund (NYSEMKT: UTG ) as a better alternative to my list of utilities in the comments section of an article I had written. I have been following the fund since that time and have placed this fund in some of the accounts I manage. UTG recently released its semi-annual report as of 4/30/2015. Total assets of the fund were $76,000 short of $1 billion and the net asset value (NAV) of the fund was $32.71 per share. UTG is currently selling for around $29.75 per share with a NAV of $30.37 as of 7/10/15. The recent underperformance of interest rate sensitive stocks has hurt both the NAV and selling price of the fund. UTG currently yields 6.1% with a monthly payout at just over $0.15 monthly. The price fluctuation of utilities does not affect the payouts of the companies so it may be an opportune time to consider this fund and/or utility stocks if one believes that interest rates will not rise shortly. UTG is a CEF or closed-end fund that aims to provide a high level of after-tax total returns consisting of tax-advantaged dividend income and capital appreciation. It targets 80% of its investment in dividend-paying common and preferred stocks as well as debt instruments of utility companies. The other 20% can be invested in other types of securities and/or debt instruments. It also uses options of utility companies in the search for returns. The historical returns of the fund when compared to the historical returns of the S&P Utilities Index and the Dow Jones Utility Average are shown in the table below: (click to enlarge) Source: UTG Semi-annual Report UTG also offered a graph showing the allocation of funds in its quarterly report as well. It is shown below: (click to enlarge) Source: UTG Semi-annual Report This graph shows that the fund’s definition of utility is rather broad. The fund holds railroads, roads, and oil and gas MLPs as well as REITs and media companies. UTG has loans for $290,000,000 with an interest rate of around 2%, which it uses for leverage. The top 10 holdings of the fund as of 3/30/15 were: NextEra Energy 5.27% ITC Holdings Corp 4.74% Union Pacific Corp. 4.67% Verizon Communications 4.26% American Water Works Co., Inc 3.96% Duke Energy Corp. 3.66% Scana Corp. 3.65% Dominion Resources, Inc. 3.59% BCE, Inc. 3.46% Sempra Energy 2.98% Expenses of this fund are about average for a closed-end fund. Investment advisory and administration fees last year ran $9.6 million or a little over 1% of the asset value of the fund. Other fees and interest on the loans add on another .5%, making a total of 1.5% to run the fund. Leverage probably covers the costs of administration with the additional dividend income it produces. Conclusion: This CEF is a good option for someone who wants to add utilities to their portfolio without the concern of researching individual companies. It appears to be a good bet for the retiree since it offers a monthly payout where much of the dividend qualifies for the 15% tax rate. The fund’s returns have kept up with the major utility indexes over its lifetime and will probably continue to do so in the foreseeable future. One should not expect to outperform the utility indexes with this CEF, but one will not likely underperform them either. Disclosure: I am/we are long UTG. (More…) I wrote this article myself, and it expresses my own opinions. I am not receiving compensation for it (other than from Seeking Alpha). I have no business relationship with any company whose stock is mentioned in this article. Share this article with a colleague