Tag Archives: alt-investing

Bargain Energy Funds To Buy As Crude Shows Uptrend

There aren’t many individuals who don’t like a good bargain. Most, or perhaps everyone, loves a great deal and such a bargain is now available in the energy sector. After the rout in crude prices last year, prices have stabilized, and crude is now gaining ground, making the sector a safer investment option. The fundamentals driving the price of the commodity look good, and thus buying energy funds at the current discount would be a prudent move. The word “downturn” fits perfectly for the energy sector. Crude prices had slumped to below $50 a barrel. Thus, the profit margins of several players from the industry have seen massive declines. This has hit stock prices as well. Nevertheless, this has made their stocks inexpensive and a really good bargain. Funds with strong fundamentals owning potential gainers from the energy sector should do well going forward, somewhat illustrated by their year-to-date gains. Before we cherry pick the energy funds, let’s look at other details. Fundamentals Driving Crude Since last June – when oil was trading around $100 per barrel – we saw a prolonged plunge in crude. This was primarily owing to the plentiful North American shale supplies when nobody seemed interested in buying, sluggish growth in China, and a dull European economy. However, the fundamentals are improving now. U.S. Energy Department’s weekly inventory release showed that crude stockpiles fell for the fifth straight week despite domestic production notching up to another record. The federal government’s EIA report revealed that crude inventories fell by 1.95 million barrels for the week ending May 29, 2015, following a decrease of 2.80 million barrels in the previous week. But the real booster should be felt on the demand side. The peak summer driving season in the U.S. – started officially this past Memorial Day weekend – and should fuel up crude consumption. According to the American Automobile Association (AAA) and IHS Global Insight, about 37.2 million travelers were forecasted to have traveled by air and road during the Memorial Day weekend. If the prediction is to be believed, then this Memorial Day weekend might have been the busiest in a decade, with the highest travel volume since 2005. Moreover, we have seen Asian demand for crude increasing. As per Energy Aspects – an independent research consultancy firm in U.K. – notwithstanding a slowing economy in China, the country’s crude import touched a record 7.4 million barrels per day in April. Additionally, according to the Ministry of Finance, customs-cleared oil imports in Japan hiked 9.1% from last April to 3.62 million barrels per day in April 2015. The improving fundamentals – as reflected in growing demand and lower supply – are reflected in the recent West Texas Intermediate (WTI) crude price of $59.72 per barrel, up significantly from the six-year low mark of $43.88 per barrel in March 2015. 3 Energy Mutual Funds to Buy Here we will list 3 Energy mutual funds that either carry a Zacks Mutual Fund Rank #1 (Strong Buy) or Zacks Mutual Fund Rank #2 (Buy). Remember, the goal of the Zacks Mutual Fund Rank is to guide investors to identify potential winners and losers. Unlike most of the fund-rating systems, the Zacks Mutual Fund Rank is not just focused on past performance, but the likely future success of the fund. The following funds are rebounding from 1-year loss and have encouraging year-to-date gains. Fidelity Select Energy Portfolio (MUTF: FSENX ) seeks capital growth over the long run. FSENX invests a lion’s share of its assets in companies involved in the energy sector including oil, gas, electricity, and solar power. FSENX primarily focuses on acquiring common stocks of companies throughout the globe. Factors such as financial strength and economic condition are considered before investing in a company. FSENX currently carries a Zacks Mutual Fund Rank #1. Its year-to-date gain is 8.8% as against 12.3% decline over 1-year period. The 3- and 5-year annualized returns stand at 7.9% and 8.5%. The annual expense ratio is 0.79% as compared to category average of 1.44%. FSENX carries no sales load. Guinness Atkinson Alternative Energy (MUTF: GAAEX ) seeks capital growth over the long term. GAAEX invests heavily in domestic and foreign companies from the alternative energy sector. GAAEX invests in companies regardless of their market capitalization and may also invest in developing economies. GAAEX currently carries a Zacks Mutual Fund Rank #2. Its year-to-date gain is 11.7% as against 7.1% decline over 1-year period. The 3-year annualized return stands at 16.7%. The annual expense ratio of 1.98% is, however, higher than the category average of 1.44%. GAAEX carries no sales load. Fidelity Advisor Energy T (MUTF: FAGNX ) invests in common stocks and in certain precious metals. The fund normally invests at least 80% of assets in securities of companies principally engaged in owning or developing natural resources, or supply goods and services to such companies, or in physical commodities. FAGNX currently carries a Zacks Mutual Fund Rank #1. Its year-to-date gain is 8.7% as against 12.6% decline over 1-year period. The 3- and 5-year annualized returns stand at 6.1% and 6.4%. The annual expense ratio is 1.34% as compared to category average of 1.44%. Original Post
Why I Am Hedging My Portfolio With UVXY

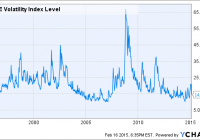
Summary The stock market is hovering near all time highs. The current bull market at 6 years is approaching the historical average. The VIX Index has not closed a month over 30 in more than 3 years. I usually stay away from investments that do not have tangible asset backing, but I have made an exception in the case of the Pro Shares Ultra VIX Short Term ETF (NYSEARCA: UVXY ). Perfect Portfolio Insurance What exactly is UVXY? According to its prospectus on the Pro Shares website, it seeks daily investment results that correspond to 2x the daily performance of the S&P 500 VIX Short-Term Futures Index. What this basically means is that this ETF rises and falls with the level of the VIX, which is more commonly referred to as “The Fear Index.” With general market levels at all time highs, there is not much fear permeating today’s business landscape. However, as market historians have learned time and again, fear is one of the most powerful human emotions, and can skyrocket at a moment’s notice. Let’s look at some of the possible reasons why the VIX could increase dramatically in the near future. The VIX Is Below Its 20-Year Averages Take a look at the following 20 year chart for the VIX: ^VIX data by YCharts As you can see, the VIX hasn’t closed a month above 30 since November of 2011, over 3 years ago. The VIX has risen to 30 or above on 10 different occasions throughout the past two decades, leaving us with an average of one spike above 30 every two years. The longest time the VIX remained below 30 was 3/31/03-9/30/08, a period of 5.5 years. Although this was a long wait, the VIX jumped all the way to its 20 year high of over 65 shortly thereafter. An era of low fear can only exist for so long in the volatile world of the stock market. This current run of low VIX readings is the second longest of the past two decades, and the longer that it continues, the higher the probability of a spike, based on historic averages. The Current Bull Market Is Almost 6 Years Old As a student of the stock market, I am fascinated by the bull and bear trends that are the fabric of investing. Although hindsight is always 20/20 in the stock market, the current trend is approaching the historical average bull market length. The longer that the market keeps running, the harder the inevitable fall will become. Since the 1950s, there have been 9 bear markets , which are defined as a drop in the S&P 500 by 20% or more from its high point. That leaves us with roughly one bear market every 6.5 years. The current bull market began in March 2009, which makes it almost 6 years old. The longer that this bull market runs past its historical average, the higher the likelihood that it will sell off and become a bear market. Current Statistics Indicate An Overvalued Market I’d love to say that I can predict exactly when the correction will happen, but I know that is a fool’s errand. I just know that the longer a trend continues in the stock market, the more people believe it to be true, which is ultimately when the sentiment changes. Robert Shiller, a renowned economist, created the Cyclically Adjusted Price-Earnings (CAPE) ratio in an effort to create a gauge of how expensive the current market is. It is tallied by dividing price by the 10 year moving average of earnings, adjusted for inflation. Check out the following historical CAPE chart for the S&P 500: S&P 500 Cyclically Adjusted Price-Earnings Ratio data by YCharts As you can see, we are currently at the same level that we were at during the peak of the 2008 market, and just under the level of the infamous 1929 crescendo. This does not mean that a crash is imminent, but it does mean that we are entering dangerous waters. Another tell tale sign of a roaring bull market is high speculation on margin. This chart shows an eerie correlation between stock prices and margin levels: (click to enlarge) Source: Business Insider As the famous Mark Twain quote goes, “history doesn’t repeat itself, but it does rhyme.” As stock prices keep increasing, people become more confident, and overextend themselves. It is a reality of the stock market today. Unless we are truly entering a fairy tale era of high margin speculation and never ending growth, this trend has to reverse itself eventually. Other Considerations The Federal Reserve has officially ended its unprecedented QE program, which has been the largest economic stimulus in world history. This is important because it is now only a matter of time before the Fed raises interest rates. It will be fascinating to see how the financial markets react to the inevitable rate hike. This will negatively impact earnings for thousands of companies that rely on borrowed money. When this happens, volatility will spike. From a macro perspective, it is a harsh reality that there is a tremendous amount of uncertainty in the world today. With Greece teetering on the edge of default and ISIS being in the news almost daily, there is high potential for a negative trigger sometime in the near future. Unfortunately, subprime lending is making a comeback and student loan debt is burdening an entire generation, causing first time home buyer rates to drop to 30 year lows . As the student loan generation ages, they will have less disposable income to spend, and thus will impact the revenues of many companies. All of these are potential catalysts that could trigger a long overdue negative reaction in the stock markets. Why Choose A Leveraged Fund? The reason I chose a leveraged ETF like UVXY rather than a standard futures ETF like the iPath S&P 500 VIX Short Term Futures ETF (NYSEARCA: VXX ) is simple: a strong conviction that the facts mentioned above will contribute to a market volatility higher than current levels in the near future. UVXY attempts to return 2x the VIX’s performance for that particular day. This means that when a spike in volatility occurs, UVXY will significantly outperform VXX, which only attempts to achieve 1x the VIX performance. Although UVXY will decline more than VXX in a low volatility market, the increased profit potential outweighs that drawback in my opinion. Risks There is one dominant risk concerning this strategy: the structure of UVXY itself. UVXY is a leveraged futures ETF, which means that it suffers exponential decay when in a period of contango. Contango is when the futures price is more expensive than the current spot price. Unfortunately, in a low volatility market like the present one, UVXY is in contango the majority of the time. Accordingly, the risk of holding UVXY for a long period of time should be obvious. It WILL lose money if the market keeps up its slow ascent and fear fails to materialize. However, history shows us that record high stock prices and low volatility cannot go on indefinitely. It is of utmost importance to exit a position in UVXY as soon as the VIX spikes in a significant way. Why is this? Because fear is a much stronger emotion than greed, but lasts for a much shorter time, which makes the spikes that much more pronounced. Accordingly, fear can vanish in an instant, so huge gains in a vehicle like UVXY can vanish in the blink of an eye. Conclusion Although the near future in stocks may continue to be bright, I believe that preparing for the worst is always a good strategy. As a holder of equities, I am hoping that the stock market continues its upward trend, but I will be prepared if it does not. I consider the decay of UVXY the monthly premium that I pay in order to hold insurance in the case of disaster. If any of the aforementioned negative triggers materialize, UVXY should increase in value, which will then allow me to add to my long positions at lower prices. As Warren Buffett is famously quoted: “Only when the tide goes out do you realize who’s been swimming naked.” All I know is that when the wave of fear hits, at least I’ll have my bathing suit on. Disclosure: The author is long UVXY. (More…) The author wrote this article themselves, and it expresses their own opinions. The author is not receiving compensation for it (other than from Seeking Alpha). The author has no business relationship with any company whose stock is mentioned in this article.

The Lesson From PXMC: Investors Shouldn’t Rely On Average Trading Volume

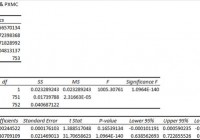
Summary I’m taking a look at PXMC as a candidate for inclusion in my ETF portfolio. Looking at the liquidity by the average trading volume is misleading in this case. Looking at number of days where no shares traded hands provides a different picture. I like the ETF for being intelligently designed, but I can’t accept the combination of expense ratios and poor liquidity. Investors should be seeking to improve their risk-adjusted returns. I’m a big fan of using ETFs to achieve the risk-adjusted returns relative to the portfolios that a normal investor can generate for themselves after trading costs. I’m working on building a new portfolio and I’m going to be analyzing several of the ETFs that I am considering for my personal portfolio. One of the funds that I’m considering is the PowerShares Fundamental Pure Mid Core Portfolio ETF (NYSEARCA: PXMC ). I’ll be performing a substantial portion of my analysis along the lines of modern portfolio theory, so my goal is to find ways to minimize costs while achieving diversification to reduce my risk level. What does PXMC do? PXMC uses an indexing approach to track the performance of the RAFI® Fundamental Mid Core Index. The ETF falls under the category of “Mid-Cap Blend.” Does PXMC provide diversification benefits to a portfolio? Each investor may hold a different portfolio, but I use SPDR S&P 500 Trust ETF (NYSEARCA: SPY ) as the basis for my analysis. I believe SPY, or another large cap U.S. fund with similar properties, represents the reasonable first step for many investors designing an ETF portfolio. Therefore, I start my diversification analysis by seeing how it works with SPY. I start with an ANOVA table: (click to enlarge) The correlation measured on a daily basis is beautiful at just over 76%. I want to see low correlations, and that is exactly what I’m finding in PXMC. However, the reliability of that correlation depends on the liquidity of the ETF. If shares aren’t trading hands, no change in price is recorded, and it appears that the value was steady even if the net asset value was changing in correlation with SPY. Standard deviation of daily returns (dividend adjusted, measured since January 2012) The standard deviation is mediocre. For PXMC it is .818%. For SPY, it is 0.736% for the same period. SPY usually has a lower level of standard deviation than other ETFs, so being a little bit above SPY isn’t too bad. With the low correlation, the ETF could still do fairly well under Modern Portfolio Theory. Why I use standard deviation of daily returns I don’t believe historical returns have predictive power for future returns, but I do believe historical values for standard deviations of returns relative to other ETFs have some predictive power on future risks and correlations. Liquidity is inconsistent The average trading volume can change dramatically depending on when investors look at it. Unfortunately, the volume can spike quite substantially. Over the 3 year time period, the average trading volume is under 1,500 shares per day. However, there are also days where over 40,000 shares change hands. In my opinion, this is a fairly dangerous liquidity situation for investors. Yield The distribution yield is 1.26%. For such an illiquid ETF, a higher distribution yield would be fairly nice for investors that were seeking to see some income from their position. The poor liquidity doesn’t bode well for investors that have to sell portions of their position to generate income. Expense Ratio The ETF has a net expense ratio of .39% and a gross expense ratio of .69%. The net expense ratio isn’t too bad, as long as it doesn’t eventually change to reflect the gross expense ratio. Market to NAV The ETF is at a .08% premium to NAV currently. When I first looked at the ETF a few weeks ago, it was trading at a .05% discount to NAV. A price swing of .13% in a few weeks wouldn’t bother me at all, but I am concerned when the discount or premium to NAV can swing that way. It reinforces my concerns about liquidity. I wouldn’t feel comfortable trading on this unless I was very confident that I had up to the minute data on the NAV. Largest Holdings The diversification is pretty good in this ETF. (click to enlarge) Conclusion I haven’t found much luck in finding a mid-cap portfolio that really appeals to me. I would love for this to be the one, but I don’t trust the statistics after seeing the poor liquidity. The average trading volume would make investors believe it held some liquidity, if they happened to look shortly after one of the spikes in volume. However, the 71 days with 0 trading volume create a real concern for me. If those days were largely behind the ETF, I wouldn’t be willing to move past it as well. However, upon closer inspection only 47 of the days had occurred before January of 2014. The other 24 days had to occur within 2014. That’s a substantial portion of the trading days. The holdings have reasonable diversification and the performance hasn’t been bad. If I thought I could leverage the poor liquidity into a meaningful discount on an entry position, then I would find that quite appealing. However, with the volume being 0 on so many days I don’t think there are many sellers willing to cross a large spread and sell at a meaningful discount to NAV. I might find the ETF fairly appealing if I was able to immediately locate deviations from NAV in real time, but I’m not looking for that level of complexity in entering a position. In a year or two, I may be looking to experiment in that realm and I would definitely consider this ETF again at that point. On the other hand, if the ETF’s liquidity improved, I would find that very appealing and would want to take another look at the ETF and test the correlation again without so many days with a volume of 0. The PowerShares portfolios I have looked at recently have had higher expense ratios, but the selection of securities seemed to be intelligent and the performance history has held up. I like those factors and would consider handling poor liquidity or a high expense ratio, but not both. Disclosure: The author has no positions in any stocks mentioned, and no plans to initiate any positions within the next 72 hours. (More…) The author wrote this article themselves, and it expresses their own opinions. The author is not receiving compensation for it (other than from Seeking Alpha). The author has no business relationship with any company whose stock is mentioned in this article. Additional disclosure: Information in this article represents the opinion of the analyst. All statements are represented as opinions, rather than facts, and should not be construed as advice to buy or sell a security. Ratings of “outperform” and “underperform” reflect the analyst’s estimation of a divergence between the market value for a security and the price that would be appropriate given the potential for risks and returns relative to other securities. The analyst does not know your particular objectives for returns or constraints upon investing. All investors are encouraged to do their own research before making any investment decision. Information is regularly obtained from Yahoo Finance, Google Finance, and SEC Database. If Yahoo, Google, or the SEC database contained faulty or old information it could be incorporated into my analysis. The analyst holds a diversified portfolio including mutual funds or index funds which may include a small long exposure to the stock.