Tag Archives: addeventlistener

European QE: Implications And Investment Opportunities

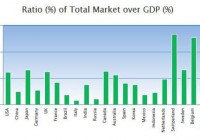
Summary The European QE, while beneficial, will have different impact and consequences than the US and the UK style QE. The retail European market is not as well developed as in the US, UK so the main risk asset likely to benefit from a large QE will be real estate. Countries with largest equity markets to GDP like the Netherlands, Belgium, France and Spain will benefit disproportionately from a risk on equity trade. Difference between European QE and US and UK style QE The European QE announced by ECB last week consists of a monthly Euros 60 bn private and public bond buying that will last until at least September 2016. The euro denominated debt purchases will be all along the yield curve between 2 and 30 years maturities and will represent no more than 25% of each issue. The debt purchases will be mutualised, sharing the loss up to 20% and the rest of 80% will stay with the national central banks. Interestingly, the government debt to be acquired by ECB is investment grade only so Greece and Cyprus debt will likely not be considered for this QE round. While both the Fed and the BoE bought back government debt, so in nature the style of the ECB QE is similar, the lack of debt mutualisation across the Euro zone will skew the benefits towards the countries with best fundamentals in 2016 when the QE starts to slow down. In addition, the funding transmission mechanism in the Euro zone does not work quite the same as in the US or in the UK. Lower rates across the euro zone should lower rates for corporates and individuals but we may not see the impact of these rates in the short term and uniformly across the Euro countries. Euro corporates use far less bond debt than the UK Plc or the US corporates. Even though the European bond market has seen significant growth after the 2009 financial crisis, the majority of the corporate debt, especially for the long term maturities and for the small and medium sized companies, is still bank debt which will be slow to adjust to market yields. The positive and perhaps intended long term consequence here is that it may encourage SMEs to increase financing with corporate bonds issuances in the eurobond market, just like it did after 2009 when bank liquidity dried up. So in the medium and longer term – this is some of the SMEs in Spain and Italy and other non-core Euro markets where the bank lending rates are at 4-6% (Reuters). Most of the immediate positive impact however will be on the larger Eurozone corporates from Germany, France, Spain and the Netherlands (that operate mainly within the Eurozone and as such don’t have a negative currency impact on their revenues) and who can improve their average debt rate substantially. Eurozone mortgages are by and large fixed mortgages from 1 to 5 years and longer and refinancing for these mortgages is not straightforward. While the proportion of variable rate mortgages has increased since 2009, the fixed rate mortgages are still predominant in France, Italy, the Netherlands and Germany, so it will take some time for the wealth effect from lower mortgages and refinancing to have an impact on the consumers in these markets. On the other hand, countries like Spain and Ireland, where most mortgages are based on variable rates may benefit most on short term. Investment Implications As yields are going down, institutional and individual investors are likely to chase higher yield assets like equities, high yield bonds and alternative assets like real estate and private equity: Equity markets in the Eurozone are not as developed as in the UK or the US relative to the size of their GDP. As the chart below shows, the ratio of the equity market to GDP in some European countries like Germany at 54% or Italy at 15% is incredibly low when compared to the UK or the US. Countries with the most developed equity markets, like the Netherlands (NYSEARCA: EWN ), Belgium (NYSEARCA: EWK ), France (NYSEARCA: EWQ ) and Spain (NYSEARCA: EWP ) will likely benefit most from a risk on equity trade. (click to enlarge) Source: Gurufocus, ECB, Reuters Low rates will benefit new investment in real estate and we are likely to see real estate prices going even further up especially in countries where equity markets are not very popular and in countries with mostly variable mortgage rates. Despite a strong performance in the past year, German REITs like Deutsche Wohnen ( OTC:DWHHF ) and Deutsche Annington ( OTC:DAIMF ) are still the best positioned to take advantage of a rising real estate market. Some Spanish real estate developers like Immobiliaria Colonial [COL.SM] may also be an interesting though volatile play. (click to enlarge) Source: Bloomberg Lower Euro will likely bring significant positive changes, even though some economists don’t think so as too many of the goods produced by the euro companies are outside of the Eurozone territory. The services sector, especially the travel and leisure sector including companies like TUI AG, is a clear winner from a lower currency. The SMEs and the corporates with competitive manufacturing bases in the Eurozone exporting outside of the area will also benefit. A lower exchange rate for the Euro will further support the exporters, especially the largest two exporters in the Eurozone who are also highly competitive manufacturers: mostly Germany (which according to WTEx, produced about 29% of the European exports in 2013 and has a large SME sector) and to a lesser extent the Netherlands (with about 9-10% of the European exports in 2013 but a smaller SME sector). In Italy only, the estimated boost to GDP from a lower currency is about 0.6% per year ( CSC, Il Sole 24) While the QE benefits will be widely spread and may give a fresh respite to countries like Italy and France, somewhat ironically the largest positive impact will benefit the countries that have fought it mostly. The Dutch and to a lesser extent the Belgian equity markets and real estate sectors in countries like Germany and Spain will likely be the big winners. Disclosure: The author has no positions in any stocks mentioned, but may initiate a long position in EWN over the next 72 hours. The author wrote this article themselves, and it expresses their own opinions. The author is not receiving compensation for it (other than from Seeking Alpha). The author has no business relationship with any company whose stock is mentioned in this article. Editor’s Note: This article discusses one or more securities that do not trade on a major exchange. Please be aware of the risks associated with these stocks. Disclosure: The author has no positions in any stocks mentioned, but may initiate a long position in EWN over the next 72 hours. (More…) The author wrote this article themselves, and it expresses their own opinions. The author is not receiving compensation for it. The author has no business relationship with any company whose stock is mentioned in this article.

Top Investment Ideas For 2015

The U.S. stock market will continue to build upon its secular bull market rally in 2015. Maintain overweight to the U.S. Consider asset classes and sectors that should benefit from rising interest rates. REITs should continue to perform. Bonds can still be effective for income and growth-oriented portfolios. I believe that the U.S. stock market will continue to build upon its secular bull market rally in 2015, and post a positive return, potentially even in the high single digit range, for the year, though there will likely be several more periods of short-term volatility over the course of 2015, similar to what we have seen thus far in January. As a result, I suggest the following portfolio management ideas for careful and thoughtful consideration for the New Year remembering that any investment portfolio should be custom tailored to an investor’s specific financial goals, income needs, investment timeframe and tolerance for risk. · Maintain overweight to the U.S. The U.S. appears to be positioned for the most upside potential in 2015, especially during the first half of the year, in comparison to other developed and emerging market countries for the following reasons: o Our contention that we are in the midst of a secular bull market and any intermittent market pullbacks may help to fuel the next leg(s) of this bull market cycle. o The U.S. economy currently resides as the “shiny city on top of the global economic hill” and should continue to generate a majority of capital inflows. o Europe appears to be struggling with how best to navigate out of their own economic recession and it may take longer for Europe to show consistent signs of economic growth than many originally forecasted though I still believe that international stocks (particularly within Europe and also including certain emerging markets) are an attractive asset class for the intermediate term, however, I expect better risk adjusted, relative performance potential over the near term in certain U.S. equity asset classes and sectors. · Consider Asset Classes and Sectors that have Historically Benefited from Improving Economic Conditions accompanied by Rising Interest Rate Environments I believe it is an appropriate time to consider making adjustments to investment portfolios to brace for the reality that interest rates will inevitably start rising, though yields may rise before any such interest rate increases if investors continue to increase allocations to bonds and thereby push up their prices. Recognizing that past performance is not a guarantee of future results, according to research report from Capital Innovations entitled, ” Most Bonds and Some Stocks Could Suffer from an Increase in Long-Term Rates “, areas such as senior loans/floating rate notes, convertible securities, high yield fixed income and certain sectors of common stocks; such as Materials, Information Technology, Energy, Consumer Discretionary and Industrials, have generally benefited historically from rising interest rate market environments ( measured for these purposes as the price impact of a 1% increase in 10-Year US Treasury rates ) during the timeframe of 1994 – 2013. We also conducted our own research at Hennion & Walsh observe which sectors performed best when the Federal Reserve embarked upon their last measured rate increase program during the years of 2004 – 2006, which I contend is the likely blueprint they will follow this time around. As you may recall, during this timeframe, the Fed raise the Federal Funds Target Rate by 25 Basis Points (i.e. 0.25%) on seventeen different occasions. Our research interestingly showed that the top performing sectors of the stock market during this time period were Energy, Utilities, Telecommunication Services, Financials ( led by REITs ), Materials and Industrials. · REITs Should Continue to Perform Many have been leery to increase allocations to Real Estate Investment Trusts (REITs) due to fears over the impact of rising interest rates on the housing market and mortgage REITs in particular. To this end, it is important to recognize that REITs are not just related to the housing market and all REITs are not Mortgage REITs. In fact, the largest component of the REITs market is not associated with Mortgage REITs, but rather is associated with Retail REITs. Other sectors of the REIT market include diversified REITs, industrial REITs, hotel and resort REITs, office REITs, residential REITs, health care REITs and specialized REITs ( including self-storage facilities ). Certain REIT sub-industries appear to be positioned well to perform in a rising rate environment for the next few years under the presumption that the Fed would not consider raising interest rates unless they believed that the U.S. economy was on a firm footing and expanding moderately well, even if the housing market is not growing as rapidly. Additionally, REITs have demonstrated that they have performed well during previous periods where the Fed has gradually raised interest rates. For example, during the previously discussed timeframe of 2004-2006, the Fed raised the Federal Funds Target Rate on 17 different occasions in 25 basis point (0.25%) increments, U.S. publicly traded REITs, as measured by the Wilshire REIT Index, experienced an average annual total return of 27.7%. Year # of Fed Fund Rate Increases Wilshire REIT Index Total Return % 2004 5 33.2% 2005 8 13.8% 2006 4 36.0% Data Source : Wells Fargo Advisors. Past performance is not an indication of future results. You cannot invest directly in an index. The Wilshire REIT Index measures U.S. publicly traded Real Estate Investment Trusts. The Wilshire US REIT Index (WILREIT) is a subset of the Wilshire US Real Estate Securities Index (WILRESI). · Remember that Bonds can be Effective for Income and Growth-oriented Portfolios It has long been our contention at Hennion & Walsh that, for income-oriented investors, bonds can provide for a dependable and consistent stream of income, and principal protection when held to maturity. Bonds, whether they are Municipal, Government or Corporate bonds, can also provide for compounded growth opportunities when the income received from the bonds is reinvested. Additionally, for growth-oriented investors, fixed income securities can provide investors with downside protection and diversification within a growth portfolio, especially in a highly volatile market where additional, measured, short-term flights to quality are likely. In our view, investors should be careful not to miss out on the income and diversification opportunities offered by bonds by trying to time future, potential changes in interest rates. History has shown us that trying to time the market, or time interest rate increases or decreases, is often an exercise in futility. With this said, it is important to understand that when interest rates do increase, bond prices may fall and yields may rise. However, rising interest rates should not impact the interest that bond holders receive on their bond holdings nor should they change the ability of these investors to receive par value on their bond holdings at maturity. Bond fund investors, on the other hand, may see the interest they receive on their fund holdings change in a rising rate environment and will not receive par value at maturity as there generally is no set maturity on bond funds. While allocations to bonds may vary based upon market conditions and investor objectives and risk appetites, certain types of bonds, from certain types of issuers, can still find a home in most investment portfolios throughout most market cycles. Please note : Hennion & Walsh Asset Management currently has allocations within its managed money program and Hennion & Walsh currently has allocations within certain SmartTrust® Unit Investment Trusts (UITs) consistent with several of the portfolio management ideas for consideration cited above. This posting is provided for informational purposes and is not a solicitation to buy or sell any of the investment strategies or companies discussed. Disclosure: The author has no positions in any stocks mentioned, and no plans to initiate any positions within the next 72 hours. (More…) The author wrote this article themselves, and it expresses their own opinions. The author is not receiving compensation for it. The author has no business relationship with any company whose stock is mentioned in this article.

The 6 Best Passive Large-Cap ETFs

By Michael Rawson The S&P 500 outperformed 80% of active managers in 2014 and beat the small-cap Russell 2000 Index by more than 8 percentage points. Strong fund flows reflected investor preference for large-cap funds as the three exchange-traded funds with the strongest flows in 2014 each track the S&P 500, an index of large-capitalization stocks. While the S&P 500 is the most popular, it is not the only large-cap index that investors can choose. A total stock market index fund is usually the most efficient way for index investors to get exposure to the U.S. stock market because they offer comprehensive coverage of the market with very low turnover. However, there are at least two scenarios where it could make sense to hold separate size segment funds. They could be appropriate for investors who want to give an overweighting to certain size segments, such as small-cap stocks, when they believe that segment will outperform. However, it is very difficult to consistently get these calls right. Because different size segments tend to exhibit different risk and return characteristics, investors could also use these funds to exercise more control over their strategic portfolio allocations. In addition, investors may use size segment funds to balance out a portfolio of active managers. The chart below illustrates the annualized volatility and return for stocks sorted by market capitalization and grouped by quintile dating back to 1926. While smaller-cap stocks have generally offered higher returns over the very long term, there have been several market cycles that favored different size segments. The S&P 500 beat the Russell 2000 each year from 1994 through 1998, but that reversed in each year from 1999 through 2004. – source: Morningstar Analysts There is no industry-agreed-upon definition for large cap , so each index provider defines the large-cap universe in its own way. Morningstar defines large cap as all of the largest stocks, which in aggregate make up 70% of the market value of all stocks; this currently corresponds to stocks with a market cap larger than $17 billion. In terms of index performance, it’s a statistical dead heat. Because the indexes have similar risk and return profiles, the choice of which ETF to use largely comes down to factors such as fees, liquidity, tax efficiency, and personal issues such as which brokerage platform is used or how the other assets in the portfolio are positioned. There are 11 ETFs that track market-cap-weighted passive indexes, excluding mega-cap and total stock market funds that also land in the large-blend Morningstar Category. In terms of fees, they charge between 0.04% and 0.20%. While these fees are low relative to the average large-blend mutual fund, which charges 1.1%, there is no reason to pay more than necessary. We can eliminate the funds charging 0.20%. In fact, it is somewhat odd that iShares is willing to charge just 0.07% for iShares Core S&P 500 (NYSEARCA: IVV ) but charges 0.15% for iShares Russell 1000 (NYSEARCA: IWB ) , which offers similar exposure. The expense ratio is just one aspect of cost. Trading costs also have an impact on total return. While the underlying stocks in each of these indexes are mostly the same and are all liquid, some of the ETFs with fewer assets trade less and have wider bid-ask spreads. For example, the iShares MSCI USA (NYSEARCA: EUSA ) has just $57 million in assets and trades less than $1 million of volume a day. The average bid-ask spread of 17 basis points would quickly eat into the returns of a frequent trader. In contrast, SPDR S&P 500 ETF (NYSEARCA: SPY ) trades more than $20 billion a day, and its bid-ask spread is frequently less than 1 basis point. U.S. equity ETFs tend to be tax-efficient because of their ability to transfer low-cost-basis shares out of the portfolio through in-kind redemptions. However, there have been instances where they have issued capital gains. This is more likely to happen to ETFs with a smaller asset base or trading volume or that happen to switch indexes. The only ETF in this group that has issued a capital gains distribution in the past 14 years is SPDR Russell 1000 ETF (NYSEARCA: ONEK ) . Personal factors also enter into the equation. Brokers such as Schwab, Vanguard, and Fidelity offer trading commission discounts for using certain ETFs (check with your broker). A $10 savings per trade can have a big impact for those investing small sums or making frequent trades. Investors should also consider how their choice will have an impact on their overall portfolio. Investors who already have assets with one index family may want to stick with that suite of index products. For example, if you have a Russell 2000 fund for small-cap exposure, you may want to use a Russell 1000 fund for large-cap exposure to avoid overlaps. After eliminating the higher-cost, less-liquid, and less-tax-efficient ETFs from the list of 11, we are left with IVV, SPY, IWB, Vanguard S&P 500 ETF (NYSEARCA: VOO ) , Vanguard Large-Cap ETF (NYSEARCA: VV ) , and Schwab US Large-Cap ETF (NYSEARCA: SCHX ) . These funds track the four market-cap-weighted indexes in the table below. S&P 500 Unlike the other indexes listed, the constituents of the S&P 500 are selected by a committee that has some discretion over which stocks make it into the index and has stricter rules regarding public float and profitability for new index additions. These rules do not have much of an impact for large caps but can have a bigger impact for small caps. In addition, S&P does not follow a set rebalancing calendar, which helps to keep turnover low. Of the four indexes, S&P has the highest average market cap and includes the fewest mid-cap stocks. The lower exposure to mid-caps explains why the S&P 500 slightly underperformed the other indexes. However, the S&P MidCap 400 outperformed most mid-cap indexes. Of the three ETFs tracking the S&P 500, we prefer IVV or VOO over SPY. While SPY is the most liquid, it is technically organized as a unit investment trust, a more restrictive legal structure, which prevents it from engaging in securities lending, reinvesting dividends, and using index futures. Consequently, SPY has lagged the S&P 500 by more than its expense ratio. CRSP US Large Cap Index This benchmark is more comprehensive than the S&P 500. It targets the largest 85% of the market and applies buffering rules to limit turnover. This sweeps in both large- and mid-cap stocks. VV adopted this index in 2013. Vanguard has a history of working with index providers to refine best practices and negotiate better fees. In fact, it previously switched some index funds to MSCI from S&P. Russell 1000 The Russell 1000 Index dips even deeper into mid-cap territory. The average market capitalization of its holdings is $54 billion compared with $72 billion for the S&P 500. The index includes all but six of the stocks that are in the S&P 500 as well as many more mid-caps. IWB is lower-cost and has better liquidity than the ETFs from Vanguard and SPDR that track the same index. Dow Jones US Large Cap Total Stock Market This index tracks approximately the 750 largest U.S. stocks and is available through SCHX. Schwab offers a suite of ETFs based on Dow Jones indexes. The Dow Jones Small Cap Total Stock Market Index includes the next largest 1,750 stocks, while the mid-cap index encompass 501st to 1,000th largest stocks. S&P acquired the Dow Jones indexes business in 2010. Schwab’s size segment funds have the lowest expense ratios in their respective categories, and liquidity has improved as these funds have gained assets. Disclosure: Morningstar, Inc. licenses its indexes to institutions for a variety of reasons, including the creation of investment products and the benchmarking of existing products. When licensing indexes for the creation or benchmarking of investment products, Morningstar receives fees that are mainly based on fund assets under management. As of Sept. 30, 2012, AlphaPro Management, BlackRock Asset Management, First Asset, First Trust, Invesco, Merrill Lynch, Northern Trust, Nuveen, and Van Eck license one or more Morningstar indexes for this purpose. These investment products are not sponsored, issued, marketed, or sold by Morningstar. Morningstar does not make any representation regarding the advisability of investing in any investment product based on or benchmarked against a Morningstar index.