Scalper1 News
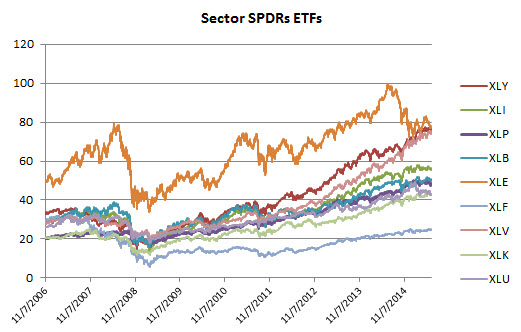
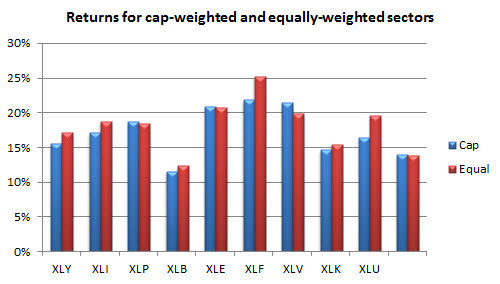
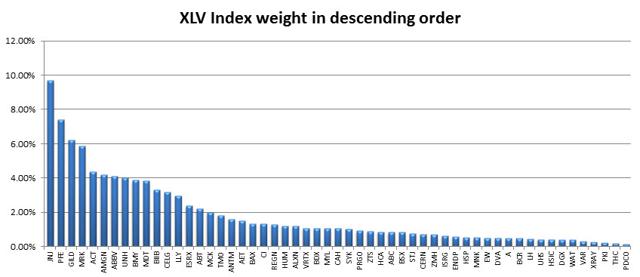
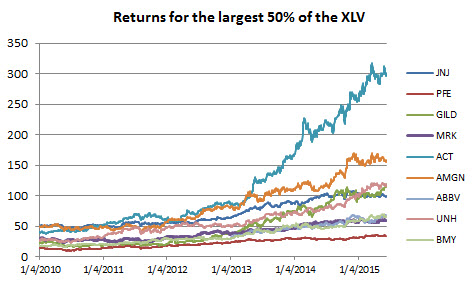
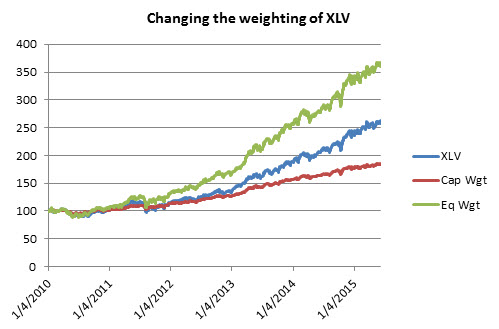
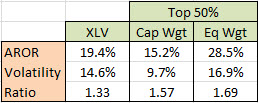
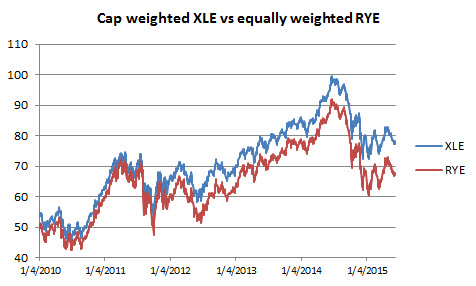
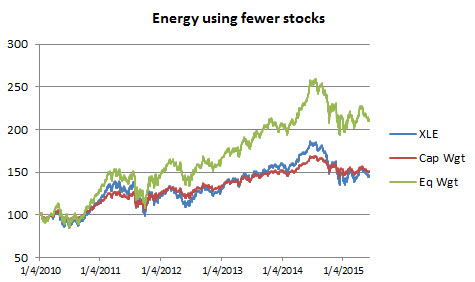
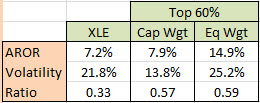
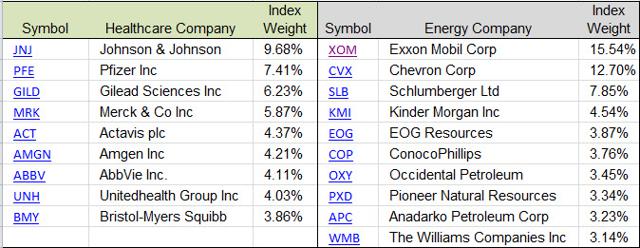 Summary Sector ETFs are great trading vehicles, but they are not weighted the best way for you. Equal weighting is always better than capitalization weighting. The problem with the existing equally-weighted ETFs is that they have too many stocks. You can do it yourself with fewer stocks and get better returns. There is no doubt that ETFs are a good way to invest. They reduce your exposure to the ups and downs of a single stock and avoid having to choose which stock in a sector is going to be the best next year. It turns out there is an easy way to get the same protection, better returns, and lower risk, doing it yourself. It goes back to understanding equal weighting versus capitalization weighting, but it doesn’t try to replicate the entire sector, it just focuses on the larger, more liquid stocks. Sector SPDRs are capitalization weighted, the same as the S&P. They deliver exactly what is expected, the portion of the S&P representing that sector, using the same calculations. We can’t evaluate every sector, so we’ll look at the best, Health Care (via the Health Care Select Sect SPDR ETF (NYSEARCA: XLV )) and one of the worst, Energy (via the Energy Select Sector SPDR ETF (NYSEARCA: XLE )). The chart below shows the performance of the major sector SPDRs since late 2006. If you combine them all, you get returns similar to the SPDR S&P 500 Trust ETF (NYSEARCA: SPY ). Equal weighting is not a new idea and the advantages are well known. Equal weighting maximizes diversification; therefore, it reduces risk. If you weight by capitalization, or any other scheme, then some stocks have greater exposure in the portfolio. For that to work, those stocks must have proportionately greater returns. Unfortunately, we don’t know that. It may turn out, strictly by chance, that the stock with the largest exposure also had the biggest returns. But the chances of that are small. The safest portfolio, and normally the most stable, is the one that has equal dollar exposure to each stock. In 2006, Guggenheim introduced ETFs that matched the sector SPDRs but were equally weighted. If there are 55 Health Care stocks in XLV then there are 55 stocks in the Guggenheim S&P Equal Weight Health Care ETF (NYSEARCA: RYH ). Similarly, there are 49 stocks in XLE and 49 in the comparable Guggenheim S&P Equal Weight Energy ETF (NYSEARCA: RYE ) . When we compare the returns of the SPDRs and the Guggenheim sectors, we see that the equally-weighted sectors performed slightly better. The information ratio, the annualized returns divided by the annualized risk, shows a similar pattern. Data source : CSI Is this what the investor, you and me, really wants? I would rather have a sector ETF that performed better than the weighted average of all the stocks in that sector, and we can do that. Components of XLV and RYH The Health Care SPDR, XLV, has 55 components, shown in the chart below in order of descending weights, with Johnson & Johnson (NYSE: JNJ ) at the top of the list with an allocation of 9.68%, and the 26 companies on the right all below allocations of 1%. Let’s look at the 9 on the left, representing 50% of the total weight of the XLV. Their performance from January 2010 is also shown below. (click to enlarge) Data source : sectorspdr.com Data source : CSI Nine stocks represent 50% of the index and the remaining 46 make up the other 50%. The smaller 50% are generally much less liquid, which tends towards greater relative volatility. More important, if we use them in an equally-weighted portfolio, will we be emphasizing companies that are very small and not representative of the performance we are seeking? Remember, we don’t care about duplicating the S&P, we are looking for better returns. Equally Weighting the Top 50% We’re going to select only a few of the stocks with the highest capitalization in the XLV, those that make up 50% of the index. Those are the 9 stocks shown in the previous chart. We’ll dollar weight them equally, then compare the results of XLV with the capitalization and equally-weighted versions using the smaller group of 9 stocks. The results are impressive. By discarding the smallest components of the index, you can increase returns significantly and reduce risk at the same time. The numbers can be seen in the Table below. Besides looking at the rate of return (AROR), the ratio of returns to risk shows that equal weighting had the best investment profile. Data source : CSI The Health Care Industry has taken off since 2008, not coincidentally timed with the passing of the Affordable Care Act. We’re not judging the merits or good intentions of that Act, but it gave the health care companies an opportunity to raise prices in advance of services, and maintain those high prices; hence, large and continued profits. Given the aging population, the industry should continue to prosper, although it seems unlikely that it could continue at this rate. The Energy Sector: XLE and RYE The Health Care sector may be an outlier, given its exceptional performance. While the energy stocks have seen wide ranging price swings, the net effect is nearly the worst performance of all sectors, certainly the highest risk. Does equally weighting the top members of this sector also improve returns? In this case we’ll choose the top 10, representing 60% of the allocations, because it’s a similar number of stocks and the allocations to energy stocks vary much more. We don’t think it makes any real difference if you use 50% or 60% of the weighting. Going through the same steps as with Health Care, we first compare the SPDR XLE with Guggenheim’s RYE in the chart below. In this case the XLE outperforms since 2010; however, the pattern is very similar. Data source : CSI We then take the 10 stocks that represent the top 60% of the XLE allocation and equally weight them. We construct cap-weighted and equally-weighted portfolios from 2010 using the same weighting as XLE. The results, in the chart below, show that equal weight again outperforms cap weighting. The numbers, also in the table that follows, shows a similar picture of higher returns and a better reward to risk ratio. Data source : CSI Doing It Yourself There is no magic in equally weighting a small number of stocks. You want enough companies to give diversification, but none of the low-cap ones. The weighting of the XLV and XLE will change regularly, but since we will be equally weighted, that won’t matter. Only the specific stocks in the top 9 for Health Care, and the top 10 for Energy will be used. “Equal” means allocating an equal dollar amount for each stock. Then an investment of $100,000 in 9 stocks means putting $11,111 into each, not much of a strain on the liquidity of these companies. JNJ at $99 would get 112 shares and Pfizer (NYSE: PFE ) at $34.50 would be allocated 322 shares. They should be rebalanced quarterly. Current Holdings The current top 50% holdings of the Health Care and 60% Energy sector ETFs are: (click to enlarge) Disclosure: The author is long XLV. (More…) The author wrote this article themselves, and it expresses their own opinions. The author is not receiving compensation for it (other than from Seeking Alpha). The author has no business relationship with any company whose stock is mentioned in this article. Scalper1 News
Scalper1 News