Scalper1 News
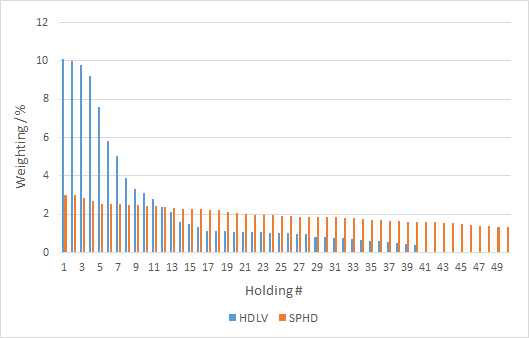
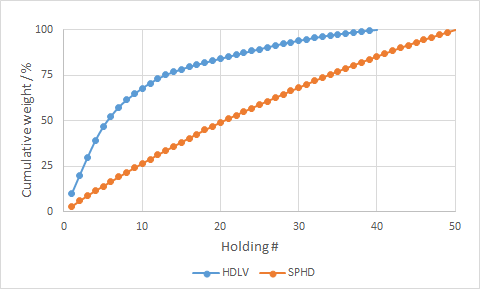
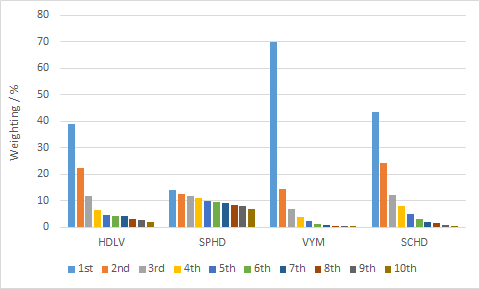
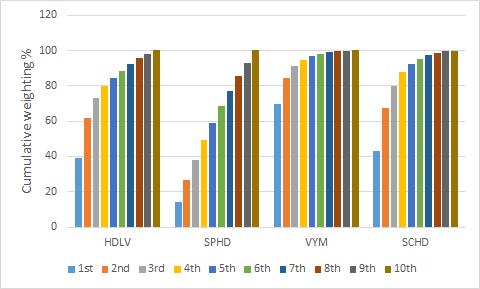
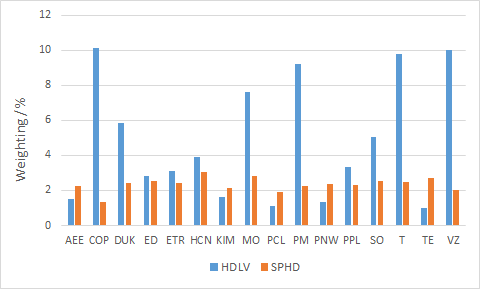
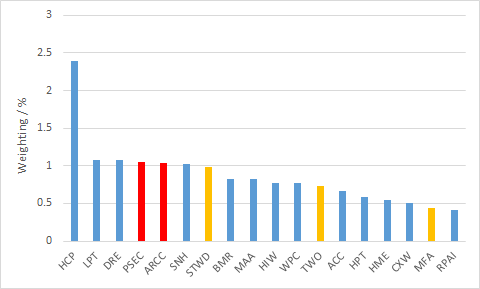
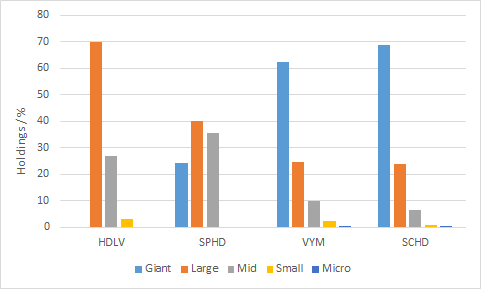
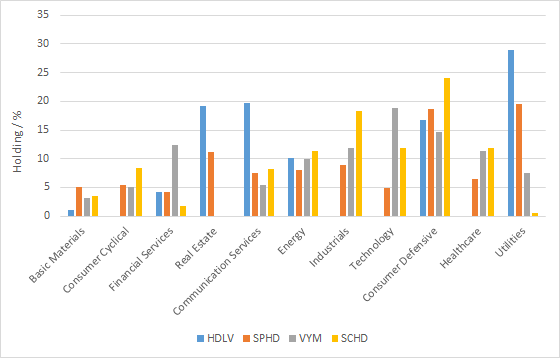 Summary UBS recently introduced a 2x leveraged ETN sporting a hefty 10% yield. This ETN tracks the Solactive US High Dividend Low Volatility Index. This ETN is compared to SPHD, another high-dividend low-volatility ETF, and two popular “quality” dividend ETFs, VYM and SCHD. Introduction UBS is the sponsor of the ETRACS series of ETNs, which includes a number of 2X leveraged funds that hold great appeal for the income investor. For example, 2X leveraged funds are available for high-yield equity sectors such as real estate (NYSEARCA: RWXL ), mortgage REITs (NYSEARCA: MORL ), master limited partnerships (NYSEARCA: MLPL ), business development companies (NYSEARCA: BDCL ), close-ended funds (NYSEARCA: CEFL ) and multi-asset income (NYSEARCA: DVHL ). In terms of “regular” dividend equity, UBS offers the 2xLeveraged Dow Jones Select Dividend Index ETN (NYSEARCA: DVYL ) and 2xLeveraged S&P Dividend ETN (NYSEARCA: SDYL ), which are the leveraged versions of the well-known iShares Select Dividend ETF (NYSEARCA: DVY ) and SPDR S&P Dividend ETF (NYSEARCA: SDY ), respectively. DVYL offers a 6.3% yield, while SDYL sports a 4.6% yield. Recently, UBS has launched a new leveraged ETF that has an even bigger yield: the 2xLeveraged US High Dividend Low Volatility ETN (NYSEARCA: HDLV ), which UBS predicts to yield 10% based on 2X the index yield. The index that HDLV tracks is the Solactive US High Dividend Low Volatility Index. Left Banker has recently penned an excellent pair of articles analyzing HDLV, in which he questioned whether or not HDLV could achieve its dual objective of high dividend and low volatility. This piece is intended to complement Left Banker’s analysis by comparing the fund with another high-dividend low volatility ETF, the PowerShares S&P 500 High Dividend Portfolio ETF (NYSEARCA: SPHD ), which I recently examined . In the comment stream of that article, I also received a number of requests to analyze the Vanguard High Dividend Yield ETF (NYSEARCA: VYM ) and Schwab U.S. Dividend Equity ETF (NYSEARCA: SCHD ). Therefore, this article will compare the characteristics of these four funds. 2xLeveraged US High Dividend Low Volatility ETN HDLV was launched in September 2014. The underlying index, the Solactive US High Dividend Low Volatility Index, was launched in July 2009. Meanwhile, SPHD tracks the S&P 500 Low Volatility High Dividend Index. Both HDLV and SPHD screen for high-dividend low-volatility companies, but have no ostensible filters for quality. VYM tracks the FTSE High Dividend Yield Index while SCHD tracks the Dow Jones U.S. Dividend 100 Index. Both VYM and SCHD have quality filters that favor companies with strong dividend growth. Fund details Fund details are shown in the table below (data from Morningstar). Note that HDLV is a 2X leveraged ETN and the yield listed is the 2X leveraged yield. HDLV SPHD VYM SCHD Yield 9.3%* 3.30% 2.68% 2.52% Payout schedule Monthly Monthly Quarterly Quarterly Expense ratio 0.85%^ 0.30% 0.10% 0.07% Inception Sep 2014 Oct 2012 Nov 2006 Oct 2011 Assets $28M $255M $10.5B $2.73B Avg Vol. 20.6K 45K 608K 355K No. holdings 40 50 394 100 Annual turnover – 47% 13% 26% *Estimated yield from 2X the weighted average yield of constituents (see below). ^Does not include financing fees. We can see from the above table that VYM is by far the most massive dividend ETF, with over $10B in assets. SCHD, despite being introduced only two years ago, has already accumulated an impressive $2.73B in assets. VYM and SCHD both charge razor-thin fees, at 0.10% and 0.70%, respectively. HDLV and SPHD are much smaller funds, at $28M and $255M, respectively. These two funds are also less liquid than their larger cousins, which could lead to higher bid-ask spreads. HDLV also charges the highest expense ratio of 0.85%, not including the financing fee required for maintaining leverage. The annual turnover of HDLV is unknown. However, given that its methodology is quite similar to that of SPHD, but with quarterly instead of semiannual rebalancing, I would expect its annual turnover % to be even higher than that for SPHD (47%). VYM and SCHD have smaller annual turnovers of 13% and 26% respectively. Methodology The steps used to construct the Solactive US High Dividend Low Volatility Index for HDLV are shown below and are reproduced from Left Banker’s article . 1. Select the 1000 top market cap names for US companies on the US regulated exchanges. Limited partnerships, master limited partnerships, OTC bulletin board issues, closed-end funds, ETFs, ETNs, royalty trusts, preferred stocks, unity trusts, equity warrants, convertible bonds, investment trusts and ADRs are all ineligible for inclusion. 2. Remove those with market caps below $1B and those having average volume below $15M. 3. Select the top 200 by market cap of those remaining. From this 200, select the 80 with the highest forward distribution yield. 4. From these 80, select the 40 with the lowest volatility rank. 5. Weight these 40 based on trailing 3-month average daily value traded across all U.S. exchanges. 6. Weights are capped at 10%. This methodology is actually very similar to that used to construct the S&P 500 Low Volatility High Dividend Index, on which SPHD is based (see my previous article for details on the methodology). Both indices use dividend yield as the primary screen and volatility as the secondary screen. A comparison of the two methodologies is shown in the table below. HDLV SPHD Universe Top 200 market cap names for US companies on US exchanges with > $1B market cap and > $15M trading volume; exclusions on equity classes (see Step 1. above) S&P 500 Primary screen (yield) Of those 200, select top 80 with the highest forward distribution yield Of those 500, select top 75 stocks with highest 12-month trailing yields, with the number of stocks from each GICS sector capped at 10 Secondary screen (volatility) Of those 80, select 40 with the lowest 12-month realized volatility Of those 75, select 50 with the lowest 12-month realized volatility Weighting The 40 stocks are weighted according to 3-month average daily value . The 50 stocks are weighted according to dividend yield Weighting restrictions Weights are capped at 10% Weights are constrained between 0.05% and 3.0%, and the weight of each GICS Sector is capped at 25% Rebalancing schedule Quarterly (Jan, Apr, Jul, Oct) Semiannually (Jan and Jul) The main functional differences in the two methodologies are: In the primary screen, HDLV screens for forward yield, whereas SPHD screens for trailing yield. SPHD applies screens for sector diversification. Not more than 10 of the 50 stocks will be from the same sector, and the weighting of each sector is capped at 25%. HDLV weights stocks by average daily value whereas SPHD weights stocks by dividend yield. The weighting of stocks by trading value, while not a unique approach, seems odd for an index that has already restricted itself to the top 200 US companies by market cap. One would think that liquidity wouldn’t really be an issue for any of these companies. A consequence of this weighting methodology is that blue-chip companies will be emphasized at the expense of lesser-known companies, as we shall see below. Constituents The 40 constituents of HDLV are shown in the table below. Data are from the UBS website . Name Ticker Weighting / % Yield / % ConocoPhillips (NYSE: COP ) 10.11 4.10 Verizon Communications Inc. (NYSE: VZ ) 10.01 4.70 AT&T Inc. (NYSE: T ) 9.77 5.50 Philip Morris International (NYSE: PM ) 9.2 4.80 Altria Group Inc. (NYSE: MO ) 7.62 4.10 Duke Energy Corp (NYSE: DUK ) 5.84 3.80 Southern Co (NYSE: SO ) 5.04 4.30 Health Care Reit Inc (NYSE: HCN ) 3.9 4.20 PPL Corp (NYSE: PPL ) 3.34 4.10 Entergy Corp. (NYSE: ETR ) 3.11 3.70 Consolidated Edison Inc (NYSE: ED ) 2.8 3.80 HCP Inc (NYSE: HCP ) 2.39 4.80 CenterPoint Energy Inc (NYSE: CNP ) 2.13 4.10 Kimco Realty Corp (NYSE: KIM ) 1.6 3.80 Ameren Corp (NYSE: AEE ) 1.5 3.60 Pinnacle West Capital Corp (NYSE: PNW ) 1.35 3.50 SCANA Corp (NYSE: SCG ) 1.14 3.50 New York Community Bancorp Inc (NYSE: NYCB ) 1.12 6.20 Plum Creek Timber Co (NYSE: PCL ) 1.11 4.20 Liberty Property Trust (NYSE: LPT ) 1.08 5.00 Duke Realty Corp (NYSE: DRE ) 1.07 3.40 People’s United Financial Inc (NASDAQ: PBCT ) 1.06 4.30 Prospect Capital Corp (NASDAQ: PSEC ) 1.05 11.60 Westar Energy Inc (NYSE: WR ) 1.04 3.40 Ares Capital Corp (NASDAQ: ARCC ) 1.04 9.60 Senior Housing Properties Trust (NYSE: SNH ) 1.03 6.90 Starwood Property Trust Inc (NYSE: STWD ) 0.99 8.30 TECO Energy Inc (NYSE: TE ) 0.97 4.50 Mid-America Apartment Comm. (NYSE: MAA ) 0.82 4.10 BioMed Realty Trust Inc. (NYSE: BMR ) 0.82 4.80 W.P. Carey Inc. (NYSE: WPC ) 0.77 5.30 Highwoods Properties Inc. (NYSE: HIW ) 0.77 3.80 Two Harbors Investment Corp (NYSE: TWO ) 0.73 10.00 American Campus Communities (NYSE: ACC ) 0.66 3.70 Hawaiian Electric Industries, Inc. (NYSE: HE ) 0.59 3.80 Hospitality Properties Trust (NYSE: HPT ) 0.58 6.20 Home Properties Inc. (NYSE: HME ) 0.54 4.40 Corrections Corporation of America (NYSE: CXW ) 0.5 5.50 MFA Financial Inc (NYSE: MFA ) 0.44 9.70 Retail Properties of America (NYSE: RPAI ) 0.41 4.00 Using these data, the weighted average yield of the constituents was calculated to be 4.7%. Therefore, we might expect HDVL to yield about twice that, or 9.3%. Concentration The trading volume-weighted methodology of HDLV has produced an index that is quite top-heavy, with the top 5 names (COP, VZ, T, PM and MO) accounting for 46.71% of the index and the top 10 names accounting for 67.94%. While you can’t really go wrong with COP, VZ, T, PM and MO as core holdings, the fact that you have two telecommunications companies (19.78% weight) and two tobacco companies (16.82% weight) in your top five does detracts from the diversity of the fund. In contrast, SPHD, which weights by dividend yield, has 14.08% in its top 5 and 26.57% in its top 10. The graph below plots the weighting of each holding (from largest to smallest). An alternative method of showing the same data is in cumulative form, with cumulative weighting of the fund plotted against the holding # (largest to smallest). We can see from both types of graphs that HDLV is more top-heavy than SPHD. In other words, the top holdings of HDLV combine for a larger proportion of the total weighting of the fund compared to SPHD. While diversification is not the be-all and end-all objective of funds, having a high proportion of the fund in the top 5 and top 10 names does increase the idiosyncratic risk of the fund. The table below summarizes the top 5 and top 10 combined weighting for HDLV, SPHD as well as for the two dividend ETFs, VYM and SCHD (manually calculated from holdings data from the fund websites). HDLV SPHD VYM SCHD % in top 5 46.71% 14.08% 22.91% 22.76% % in top 10 67.94% 26.57% 35.99% 20.52% The data above show that HDLV has the highest concentration of assets in the top 5 and the top 10 holdings out of all four of the dividend funds. However, because VYM has 394 holdings and SCHD has 100 holdings, it was difficult to show their weighting distribution on the same scales. Therefore, I grouped the holdings of the four funds into deciles, and manually calculated the combined weighting of each decile for each fund. The results are shown graphically below: We can see from the graph above that when you analyze the funds in terms of deciles, VYM appears to be the most top-heavy fund. However, keep in mind that VYM also has 394 constituents. So while the top 10% of holdings in VYM combine for nearly 70% of the fund’s weight, that 70% is actually divided amongst 40 stocks. Interestingly, we also observe that the last three deciles for VYM (30%, or ~120 stocks) combine for just over 1% of the fund. This begs the question: do they really have to be there? One would think that squeezing out that incremental bit of performance from the last 1% of the fund composition is outweighed by the administrative expense of keeping track of those extra positions! I think that capping the number of holdings to a maximum of around 100 (like SCHD) makes a lot more sense. The same data shown in cumulative fashion: We can also see from the graphs above that SPHD has the most even distribution of weightings across the 10 deciles. In other words, it is the ETF that is the closest to an equal-weight fund. I do personally like this style, and other authors have shown that the equal-weight S&P 500 (NYSEARCA: RSP ) has outperformed SPY over long periods of time (see Ploutus’ article here ). Overlap As mentioned above, HDLV and SPHD use quite similar screening methodologies, though with different weighting schemes. How much overlap do they have in their holdings? HDLV has 40 holdings and SPHD has 50 holdings. To determine the overlap, I manually inspected the holdings and found that the two funds had 16 stocks in common: AEE, COP, DUK, ED, ETR, HCN, KIM, MO, PCL, PM, PNW, PPL, SO, T, TE and VZ. The observation that the two funds did not have even more stocks in common is probably due to the fact that SPHD draws from S&P 500 stocks while HDLV selects from the top 200 market cap names passing a liquidity filter. Additionally, SPHD has a sector filter preventing more than 10 companies from the same sector appearing in the 75-member shortlist of stocks. The % allocation of the 16 stocks common to the two funds are shown below. Additionally, a manual calculation of the weightings shows that HDLV and SPHD have an overall 33% overlap in their holdings. How much overlap is there between the high-dividend low-volatility funds HDLV and SPHD with the two “quality” dividend ETFs VYM and SCHD? Thankfully, ETF Research Center has a nifty tool that allows the overlap between two ETFs to be calculated automatically. Unfortunately, this tool does not extend to ETNs and the calculations for HDLV had to be done manually. To my knowledge, there is no ETF tracking the same index as HDLV. The table below shows the % overlap between the four funds, with the number of holdings in common shown in parentheses. HDLV SPHD VYM SCHD HDLV – 33% (16) 9% (15) 13% (4) SPHD 33% (16) – 28% (44) 25% (23) VYM 9% (15) 28% (44) – 51% (89%) SCHD 13% (4) 25% (23) 51% (89) – Not surprisingly, VYM and SCHD, which are both “quality” dividend ETFs, have quite a high degree of overlap between them (51%). Moreover, there is relatively low overlap between HDLV/SPHD and VYM/SCHD. HDLV have overlap values of 9% and 13% with VYM and SCHD, respectively, while SPHD has overlap values of 28% and 25% with VYM and SCHD, respectively. The lower overlap values of HDLV is likely a consequence of its more inclusive selection universe. A manual calculation reveals that 15.7% of HDLV’s holdings are unique (i.e. stocks that are not found in any of the other 3 funds). Of this 15.7%, 11.4% are REITs, 2.2% are BDCs and 2.1% are mREITs. The graph below shows the unique holdings of HDLV. Blue bars show REITs, orange bars show mREITs and red bars show BDCs. Therefore, while HDLV scores poorly for concentration, it actually has more diversity in terms of stock type. This is mainly because VYM and SCHD do not include significant amounts of REITs, mREITs and BDCs. SPHD also has some REITs (such as KIM and HCN that are also in HDLV), but it has no mREITs or BDCs. On the flip side, investors not comfortable with owning mREITs and BDCs in any capacity should avoid HDLV. Performance Since HDLV has only been recently launched, sufficient performance data is not available. However, while the underlying Solactive US High Dividend Low Volatility Index was established in July 2009, the data provided by the index sponsor is incomplete. Therefore, only a limited amount of data could be provided in this section. Note also that while the index data for HDLV is presented in the table below, the data for SPHD, VYM and SPCD are the numbers for the actual ETFs. Therefore, in this comparison, the performance of HDLV would be overestimated because the index is not subject to fees. Data for HDLV [index] is from the index sponsor and data for the other three funds are from Morningstar, except for volatility (2Y) which is from Investspy . HDLV* SPHD VYM SCHD SPY 1-year return % 23.8 22.7 16.4 14.7 16.5 5-year return (ann.) % 17.0 – 16.2 – 15.5 Volatility (2Y) % – 9.7 10.3 10.1 11.3 Volatility (3Y) % – – 8.53 8.22 9.02 Volatility (5Y) % 11.4^ – 11.32 – 12.95 Sharpe ratio (3Y) – – 2.21 2.18 2.15 Sharpe ratio (5Y) 1.73^ – 1.41 – 1.20 *Index data reported. ^Data for 5.5 years Due to the paucity of data for HDLV and SPHD, a full performance picture could not be obtained. Despite this, some general observations can still be made: HDLV and SPHD have had much higher 1-year total return performances than SPY, while VYM and SCHD have had similar 1-year returns to SPY. This could be due to the surprisingly persistent decline of interest rates in 2014 that has boosted the value of higher-yielding assets (HDLV/SPHD contain more “bond-like” equities compared to VYM/SCHD, see sector analysis below). The five-year annualised return of the HDLV (17.0%) is slightly higher than VYM (16.2%) and SPY (15.5%). However, remember that the performance of the index does not account for fees. Over a period of about 5 years, the volatility of HDLV is similar to that of VYM. HDLV and VYM both have lower volatility than SPY. This therefore appears to validate HDLV’s screening methodology for low-volatility stocks. Additionally, this data suggests that screening for quality (as in VYM) can also (indirectly) favor companies with lower volatility. This is probably because higher quality companies tend to also have more stable earnings and cash flows. The 2-year volatility of SPHD is slightly lower than that for VYM and SCHD. Those three funds also have lower volatility than SPY. Therefore, the same conclusion can be drawn as for Point 3. Valuation The table below shows various value and growth metrics for HDLV, SPHD, VYM and SCHD and SPY. Data for all funds except HDLV are from Morningstar (value metrics including dividend yield are forward looking). Morningstar does not show statistics for ETNs so the metrics for HDLV were manually calculated using trailing data from Seeking Alpha. The first five rows can be considered as value metrics while the last five rows can be considered as growth metrics. Unfortunately growth metrics for HDLV could not be determined. HDLV SPHD VY M SCHD SPY Price/Earnings 21.75 20.40 16.54 17.41 18.01 Price/Book 4.29 2.08 2.36 2.95 2.49 Price/Sales 3.08 2.03 1.81 1.70 1.79 Price/Cash Flow 15.81 9.30 7.06 9.96 7.79 Dividend yield % 4.66 3.98 3.17 2.97 2.07 Projected Earnings Growth % – 6.61 7.58 7.26 9.70 Historical Earnings Growth % – 5.31 6.84 10.66 8.18 Sales Growth % – 1.7 2.55 2.60 3.07 Cash-flow Growth % – 2.20 2.47 4.27 6.39 Book-value Growth % – 3.87 7.31 8.03 7.58 In terms of valuation metrics, HDLV appears at first glance to be much more expensive than SPHD, VYM and SCHD. However, one unintended benefit of not having aggregate data available for an ETN such as HDLV from Morningstar is that it forced me to curate and process all of the data manually. From this exercise I observed that the REITs in HDLV were significantly skewing the valuation metrics in the fund. For example, HCN, a 3.9% component of HDLV, has P/E and P/CF values of 86.7 and 96.1, respectively. Although we know that P/E isn’t really an appropriate measure of valuation for REITs (P/FFO is better), I couldn’t think of a way to avoid this problem. Removing all of the REITs from the calculations for HDLV was one possible, but unsatisfying, solution. Putting HDLV aside for a moment, the data for the other three funds and SPY are more comparable since [i] they are all from Morningstar and [ii] they contain less REITs. We can see from the data that SPHD has worse growth metrics than VYM or SCHD (recall that in the previous article , SPHD also had worse growth metrics compared to VIG). This is probably a consequence of SPHD using dividend yield as a primary screen, whereas VYM and SCHD both have quality filters that would favor companies with stable earnings growth. SPHD also has higher P/E but lower P/B compared to VYM and SCHD (but this could also be slightly skewed to the detriment of SPHD due to the REIT allocation in the fund). Finally, the dividend ETFs have similar valuation metrics but lower growth metrics compared to SPY. Size The table below shows the market cap distribution for the four dividend ETFs. Data for SPHD, VYM and SCHD are from Morningstar. Data for HDLV are manually calculated using information from Morningstar. HDLV SPHD VYM SCHD Giant 0 24.10 62.50 68.89 Large 70.02* 39.94 24.50 23.78 Mid 26.99 35.56 10.03 6.47 Small 3.03^ 0 2.42 0.75 Micro 0 0 0.52 0.10 *Includes giant caps. ^ Includes micro caps. Morningstar unhelpfully does not provide size classifications for individual stocks beyond their large, medium and small style boxes (unlike their aggregate data for ETFs which distinguishes between five size categories), so I was not able to make a distinction between giant- and large-cap stocks and between small- and micro-cap stocks for HDLV. Morningstar defines giant-cap stocks as those accounting for the top 40% of the total US stock market capitalization, and I was unable to figure out an efficient way to determine whether a stock fell in the large cap or giant cap category. The data are also displayed graphically below. We can see that HDLV and SPHD both contain more medium/low-cap exposure compared to VYM and SCHD, which I consider to be a net positive. Sector The table below shows the sector composition of HDLV, SPHD, VYM and SCHD, with SPY also shown for comparison. Data for HDLV was manually calculated, while the rest of the data are from Morningstar. HDLV SPHD VYM SCHD SPY Basic Materials 1.11 5.01 3.13 3.50 3.03 Consumer Cyclical 0 5.51 5.01 8.44 10.38 Financial Services 4.27 4.21 12.34 1.84 15.16 Real Estate 19.10 11.16 0 0 2.09 Communication Services 19.78 7.56 5.42 8.21 3.80 Energy 10.11 8.03 9.99 11.26 8.53 Industrials 0 8.92 11.93 18.38 11.14 Technology 0 4.93 18.80 11.84 17.95 Consumer Defensive 16.82 18.60 14.62 24.04 9.72 Healthcare 0 6.55 11.31 11.94 15.04 Utilities 28.85 19.52 7.46 0.55 3.17 We can see that HDLV is concentrated in the real estate (19.10%), communication services (19.78%), consumer defensive (16.82%) and utilities (28.85%) sectors, that together account for 84.55% of the fund. It has no allocation to consumer cyclical, industrials, technology, and healthcare, whereas all of the other funds do. Notably, the 28.85% allocation to utilities in HDLV is over the 25% sector cap that is applied to SPHD. In my view, the lack of sector diversification of HDLV is a major drawback of the fund. We can also confirm here that VYM and SCHD have no allocation to REITs or mREITs, as shown by their 0% exposure to real estate. Comparing HDLV/SPHD to VYM/SCHD also reveals key differences in their sector allocations. HDLV/SPHD have (on average) higher allocations to real estate, communication services, consumer defensive and utilities. Conversely, VYM/SCHD have (on average) higher allocations to energy, financials, industrials, technology and healthcare. This suggests that HDLV/SPHD, which screen for high dividends and low volatility, tend to favor defensive or “bond-like” equities. However, the trade-off is that those companies will show slower growth statistics, as we saw in the valuation section above. The data are also displayed in graphical form below: Conclusion This article sought to compare HDLV with SPHD, which are both high-dividend low-volatility funds. Moreover, comparative analysis with VYM and SCHD, popular “quality” dividend funds was also conducted due to popular demand. While HDLV does appear to meet its dual objectives for high dividends and low volatility, at least when using data provided for the underlying index, my impression of this fund is less positive than for SPHD. Here are three reasons why I think SPHD is superior to HDLV as a high-dividend low-volatility fund: SPHD weights by dividend yield whereas HDLV weights by trading volume. This causes HDLV to become very top-heavy, with the top 5 holdings accounting for 46.71% of the fund. Meanwhile, SPHD is the closest to an equal-weight fund out of the four funds studied, which I consider to be a positive. HDLV lacks sector diversification. Of the top 5 names in HDLV, there are two telecommunication companies and two tobacco companies, that together account for 36.6% (!) of the whole fund. Moreover, the sector breakdown shows that HDLV is heavily concentrated in four sectors that account for 85% of the fund. On the other hand, SPHD has sector restrictions at both the stock selection level and the weighting level. It contains a significant % of equity REITs, and some mREITs and BDCs. Not that I’m against these stock classes (as readers of the Buy-The-Dip High-Yield portfolio would know), but I know that many investors would be uncomfortable with owning these as part of a core holding ETF. Moreover, the quarterly rebalancing means that the levels of these alternative stock classes would vary over time. The only positive for HDLV I can think of is if an investor actually preferred to include more REITs, mREITs and BDCs in their high-dividend low-volatility portfolio. While I include myself as one of those investors, I believe that the negatives outweighs this positive. Note also that analysis was conducted on an index vs. index fashion. There are also specific risks to owning a 2X leveraged ETN such as HDLV: An ETN is subject to counterparty risk of UBS. If UBS goes bankrupt, the notes become worthless. A 2X leveraged fund is subject to leverage decay, although the monthly reset does ameliorate this somewhat. Investors will be charged a financing fee by UBS for said leverage, although it should still be cheaper compared to obtaining margin on your own. Scalper1 News
Scalper1 News