Scalper1 News
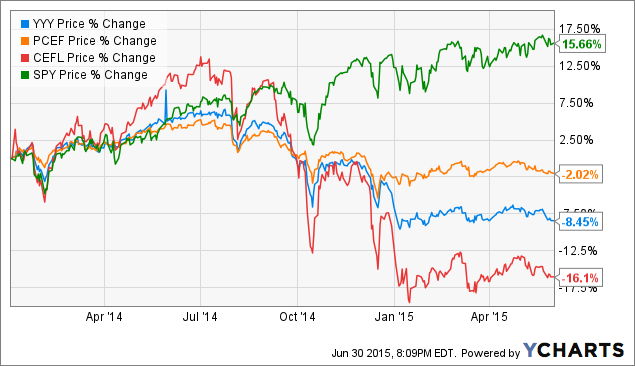
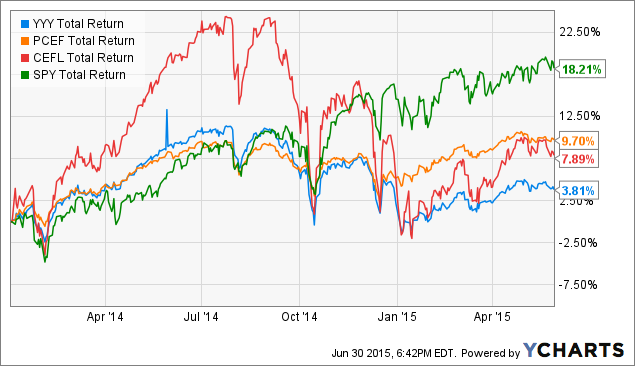
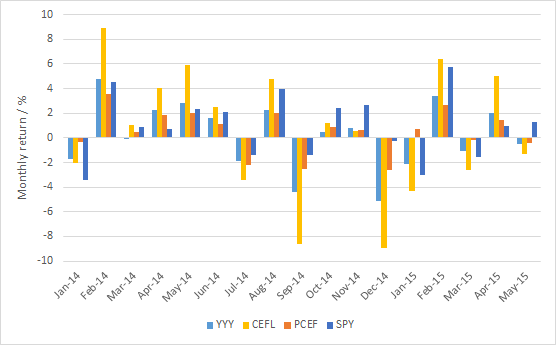
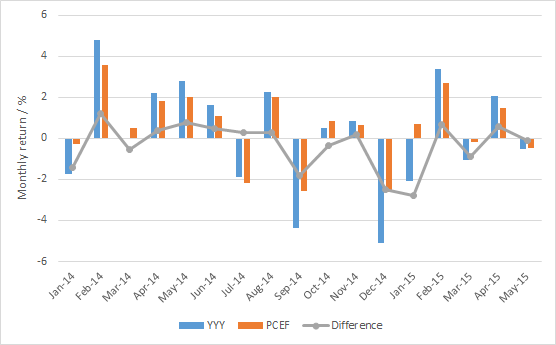
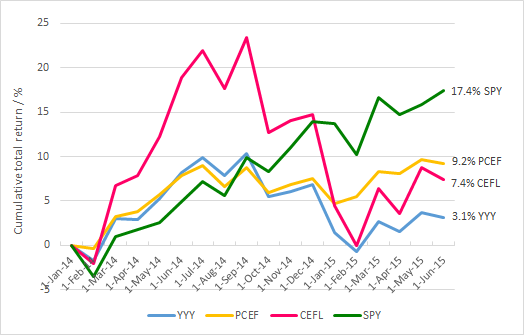
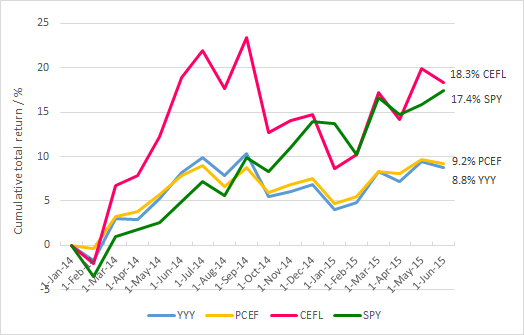
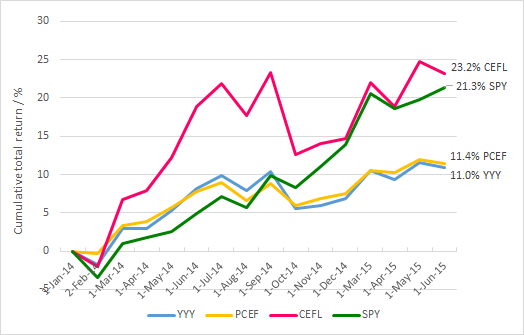 Summary CEFL’s share price has reached all-time lows. After accounting for reinvested dividends, CEFL’s total return doesn’t seem all that bad. If we exclude the two “rebalancing months” at the turn of this year, CEFL has actually done pretty well. Introduction The UBS ETRACS Monthly Pay 2xLeveraged Closed-End Fund ETN (NYSEARCA: CEFL ) is a 2X leveraged fund of close-ended funds [CEF] that sports a juicy 21.8% yield, according to Lance Brofman’s recent article . However, recent events have caused CEFL’s share price to fall to an all-time low since its inception in Dec. 2013, something that is frequently mentioned in the comment streams of articles on CEFL. The following chart shows the price return of CEFL compared to two other funds from Jan. 1st, 2014 to May 31st, 2015 (the reason for this date range will become apparent later). The YieldShares High Income ETF (NYSEARCA: YYY ) tracks the same index, the ISE High Income Index, as CEFL, but is unleveraged. The PowerShares CEF Income Composite ETF (NYSEARCA: PCEF ) is also a fund-of-CEFs but it tracks a different index. The broader U.S. market SPDR S&P 500 Trust ETF (NYSEARCA: SPY ) is shown for comparison. YYY data by YCharts As can be seen from the above chart, Jan. 1st, 2014 to May 31st, 2015, CEFL declined by -16.1%, which is approximately twice that of YYY at -8.45%, whereas PCEF declined by only -2.02%. SPY had a price return of 15.66%. Undoubtedly, CEFL’s price-only action has been ugly. Effect of reinvesting dividends What if dividends are accounted for? The following chart shows the total return of the same four funds, i.e. with dividends reinvested. YYY Total Return Price data by YCharts We can see from the above graph that if dividends are accounted for, CEFL’s total return becomes positive, at +7.89%. YYY had a total return of +3.81% over this period, while PCEF had a total return of +9.70%. SPY’s total return was +18.21%. Effect of last year’s rebalancing shenanigans As I have written about previously ( I , II , III ), CEFL/YYY holders were seemingly shafted during the index’s annual rebalancing event in Dec. 2014. The CEFs that were to be added to the index exhibited unusual increases in both price and volume, whereas the CEFs that were to be removed from the index exhibited unusual increases in volume but decreases in price. This apparent “frontrunning” caused CEFL/YYY to sell low and buy high, resulting in significant losses for the funds (and ergo, its investors) upon rebalancing. Moreover, CEFL/YYY continued to underperform in Jan. 2015 as the newly-added CEFs, whose prices were artificially inflated to aberrant levels, exhibited mean reversion. All of this discussion can be found in greater detail in my previous articles linked above. The following chart shows the monthly total returns for the four funds from Jan. 2014 to May 2015. Data were obtained from Morningstar . (As of time of writing, monthly return data for Jun. 2015 were not yet available). We notice that from the above chart that YYY/CEFL had their worst performances in Sep. 2014 and Dec. 2014. However, to get a better feel for the effect of rebalancing, the following chart shows the monthly returns for only YYY and PCEF (as both are unleveraged), with the difference being drawn as a line. From the above chart, the effect of the rebalancing shenanigans on YYY/CEFL becomes clear. Although YYY showed the lowest absolute performances in Sep. 2014 and Dec. 2014, the two months where it underperformed most on a relative basis (compared to PCEF) were Dec. 2014 (-2.48%) and Jan. 2015 (-2.78%), i.e. the two months associated with the rebalancing event. Given that both YYY and PCEF are CEF fund-of-funds, this underperformance lends further credence to my hypothesis that YYY/CEFL holders were significantly disadvantaged by the rebalancing event. Total return profiles with and without rebalancing shenanigans From the monthly return data, I reconstructed the total return profiles for the four funds from Jan. 2014 to May. 2015. Note that the final total return percentages for the funds are within 1% of the numbers reported by YCharts shown above (see second chart of this article), indicating that the reconstruction methodology I used was reasonably accurate. Now, let’s pretend we were living in an alternate universe where YYY/CEFL holders were not shafted by the rebalancing event. To model this, I changed YYY’s monthly returns for Dec. 2014 and Jan. 2015 to be the same as PCEF’s (since both are fund-of-CEFs), and made CEFL’s monthly returns for those two months twice that of YYY’s. The following chart shows the reconstructed total return profiles for the four funds. Wow! What a difference two months makes! Instead of languishing with a +7.4% total return from Jan. 2015 to May. 2015, CEFL jumps to the top of the pack with a total return of +18.3%, edging out even SPY. An alternative approach is to assume that the months of Dec. 2014 and Jan. 2015 never happened . The following chart shows the reconstructed total return profiles for the four funds, except that Dec. 2014 and Jan. 2015 are skipped. In other words, the monthly total return for Feb. 2014 was applied to value of the funds at end-Nov. 2014. Similar results are observed with the two rebalancing months skipped. CEFL again comes out on top with a 23.2% total return, beating SPY by nearly 2%. Additionally, the two graphs above both show that once we account for rebalancing shenanigans using either of the two approaches, YYY and PCEF have very similar total returns, which might be expected because both funds screen for high-yielding CEFs for inclusion. Discussion and conclusion In many comment streams of articles regarding CEFL, many commentators opine that CEFL is a broken product due to its poor price performance, not to mention its high fees and inclusion of return of capital [ROC]-paying CEFs. While it is true that CEFL’s price has declined by 20% since inception and is currently at all-time lows, its total return, which includes reinvested dividends, has been positive. (This is true even when accounting for CEFL’s horrendous performance in Jun. 2015, which was not included in this analysis). Moreover, this article showed that a significant part of YYY/CEFL’s underperformance can be explained by the rebalancing shenanigans that occurred in Dec. 2014, followed by further underperformance in Jan. 2015 as the artificially-inflated CEFs in the index reverted to the mean. Accounting for those two rebalancing months using either one of two approaches resulted in a vastly improved total return profile for CEFL that was superior even to that for SPY over the period of Jan. 1st, 2014 to to May 31st, 2015. Additionally, we showed that YYY and PCEF had very similar total return profiles once those two rebalancing months were accounted for as well. Based on this analysis, I would conclude that CEFL is not an inherently broken product – except for its current rebalancing mechanism. My opinion is that UBS should really do something about the rebalancing protocol to ensure that CEFL/YYY holders do not get ripped off again this year. As for myself, I will be selling all of my CEFL in early December or even before that, and watch events unfold from afar. Further analysis on the constituents and properties of CEFL can be found in my three-part series “X-Raying CEFL”. Disclosure: I am/we are long CEFL. (More…) I wrote this article myself, and it expresses my own opinions. I am not receiving compensation for it (other than from Seeking Alpha). I have no business relationship with any company whose stock is mentioned in this article. Scalper1 News
Scalper1 News