Scalper1 News
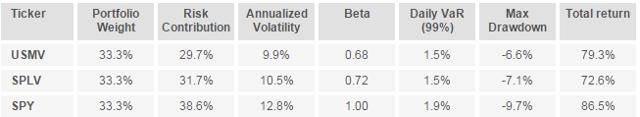
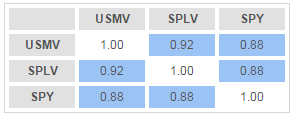
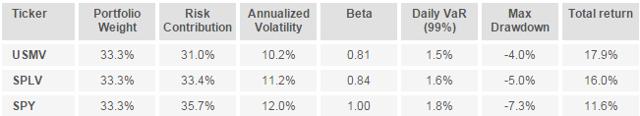
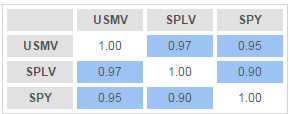 Low-volatility ETFs have close to $20 billion in AUM. Both USMV and SPLV achieve their objectives against the benchmark. USMV has been the more efficient and cheaper choice than SPLV thus far. Ever since I wrote my thesis on minimum-variance portfolios six years ago, I have maintained a strong interest in low-volatility investing. This type of investment has gained popularity over the last few years with the US markets now featuring 21 low-volatility ETFs that have combined assets under management of almost $20 billion. I have decided to take a look at how the largest funds in this space have performed from the risk perspective. For the purpose of this analysis, I have focused on the two flagship low-volatility ETFs – the iShares MSCI USA Minimum Volatility ETF (NYSEARCA: USMV ) and the PowerShares S&P 500 Low Volatility Portfolio ETF (NYSEARCA: SPLV ) – which have around $5 billion of AUM each. Both of these funds invest solely in the US stock market, making them easy to compare. The SPDR S&P 500 Trust ETF (NYSEARCA: SPY ) is used as the benchmark. Utilizing the freely available investor tool on InvestSpy and using the full data history, I obtained the following results: (click to enlarge) The table above reveals that both USMV and SPLV demonstrated substantially reduced beta and realized volatility than SPY. However, the degree of success differed, as USMV had a lower beta (0.68 vs. 0.72) and lower realized volatility (9.9% vs. 10.5%) compared to SPLV, making the former a superior performer from the risk perspective. In addition to that, USMV delivered a 6.7% higher total return than SPLV whilst both low-volatility ETFs trailed SPY. Looking at the correlations computed on the same analytical website, it turns out that both funds had a correlation with SPY of 0.88. Although the figure is relatively high, this is still a favorable finding given that these funds invest pretty much in the same universe of stocks as SPY. Analyzing the data only for the last year yields a similar result, as USMV again outperforms SPLV in all respects. However, the overall benefit from the low-volatility phenomenon has been weaker over the last 12 months, as beta values increased above 0.8 and annualized volatility was much closer to that of SPY’s, particularly in the SPLV’s case. (click to enlarge) The correlation coefficients have also changed in the past year with USMV and SPLV moving even closer together. It is interesting to note that USMV’s correlation coefficient with SPY has increased sharply to 0.95, making it a less desirable portfolio component from the diversification perspective. Summing up, USMV appears to have beaten SPLV thus far virtually in all respects, posting lower beta, lower realized volatility and higher returns. In addition to that, USMV was also a cheaper alternative, charging 0.15% as opposed to 0.25% by SPLV. However, it is important to note that markets constantly evolve and investors should monitor the performance of “smart beta” products on a regular basis. It is hard to make a case for SPLV now, but a simple change such as the recent spike in correlation with the S&P 500 may easily put USMV out of favor. Disclosure: I/we have no positions in any stocks mentioned, and no plans to initiate any positions within the next 72 hours. (More…) I wrote this article myself, and it expresses my own opinions. I am not receiving compensation for it (other than from Seeking Alpha). I have no business relationship with any company whose stock is mentioned in this article. Scalper1 News
Scalper1 News