Author Archives: Scalper1

The iShares Exponential Technology ETF Dilutes Exposure With Blue Chips

Summary XT invests in companies developing or using exponential technologies. XT owns many large companies that only have a small exposure to these technologies. Due to blue chip holdings, XT is not as volatile as one might expect from the name, good for conservative investors, but may disappoint those seeking pure plays. The iShares Exponential Technology ETF (NYSEARCA: XT ) seeks to replicate the overall performance, before fees, of the benchmark Morningstar Exponential Technologies Index. This index is comprised of stocks issued by developed and emerging market companies that create and use exponential technologies. Exponential technologies are those which lead to exponential growth, creating entirely new markets where none existed only years before. Most of the companies in this fund use rather than create exponential technologies, which are much rarer. Take a company such as Netflix (NASDAQ: NFLX ), the top holding with 1.22 percent of assets. Netflix uses Internet technology and is riding a wave of technological change, but Netflix didn’t create the technology behind it. Index & Strategy Following the underlying benchmark, XT invests in developed and emerging market companies involved in nine different fields, or themes, which fund managers deem to be “exponential technologies.” These innovative technologies are replacing outdated systems and methodologies. The areas include big data and analytics, bioinformatics, energy and environmental systems, financial services innovation, medicine and neuroscience as well as nanotechnology, networking, robotics and 3-D printing. XT invests at least 80 percent of its assets in securities found in the underlying index. While the fund provides solid exposure to up-and-coming technology companies, such as Illumina (NASDAQ: ILMN ), Splunk (NASDAQ: SPLK ) and Hologic (NASDAQ: HOLX ), it also holds well-established blue chip companies like Airbus (OTCPK: EADSY ), AT&T (NYSE: T ), Boeing (NYSE: BA ), DuPont (NYSE: DD ), Monsanto (NYSE: MON ) and Pfizer (NYSE: PFE ). Those latter firms are unlikely to experience exponential stock price increases because they’re already large blue chip companies. The former firms are more dynamic pure plays on emerging technologies. Illumina develops, manufactures and markets integrated systems that serve the gene expression, sequencing and genotyping industry. Splunk creates software that searches, monitors and analyzes machine-generated big data. Top 10 holding Hologic develops and supplies diagnostic imaging systems related to women’s health. The mix of holdings in XT offers investors the opportunity diversify their portfolios with growth stocks across a wide range of technologies, market caps and geographic locations, but without taking on as much risk as one might expect (and for aggressive investors, want) from a fund with the name “exponential technology.” Index components are scored across individual analysts, sectors and themes. Managers review the scores and collectively select leading candidates for inclusion in the index. Each theme will have one to five leaders. The index is reconstituted annually. At that time, potential candidates for inclusion must have average 3-month trailing daily trading volume in excess of $2 million and a market cap of more than $300 million. Stocks already in the index must have maintained an average 3-month trading volume over $1.5 million and a market cap greater than $200 million. Stocks not meeting these criteria are eliminated from consideration. The remaining qualified candidates are ranked in order of their exposure to exponential technology themes. Managers rank the stocks using specific criteria, such as the number of themes in which the stock is a leader. They also consider the number of themes in which it scores above average and market capitalization with a preference for smaller firms over shares of larger cap names. The 200 highest scoring stocks are included in the index. The ETF’s managers then select and equally weight shares from this index to create the fund’s portfolio. Thus, while XT is technically not an actively managed fund, the selection of components is made by somewhat subjective measures. Portfolio Composition and Holdings XT is a large core growth fund with slightly more than $686 million in assets allocated across 195 individual holdings. The portfolio holds 67 percent of asset in domestic stocks and 31 percent in foreign shares. The fund’s foreign exposure includes Developed and Emerging Europe as well as Developed and Emerging Asia. In addition to the United States, the fund is invested in companies headquartered in the United Kingdom, France, Switzerland and Denmark as well as Canada, Japan, Australia and India. XT holds 27 percent of assets in giant cap stocks along with 40 percent in large caps, 28 percent in mid-cap stocks and 5 percent in small caps. The fund also has a small exposure to micro-cap shares. Compared to the category averages, the ETF is underweight giant caps and overweight large- and mid-cap stocks. XT is heavily weighted towards the technology, health care and telecommunication sectors. The fund’s top 10 holdings comprise 7.9 percent of total assets. These include Netflix , Valeant Pharmaceuticals (NYSE: VRX ), Amazon (NASDAQ: AMZN ), and Seattle Genetics (NASDAQ: SGEN ). While there are many large caps in the portfolio, XT has an average market capitalization of $23.3 billion, which is less than the technology category averages of $40.8 billion. XT shares have a P/E ratio of 20.94 and a price-to-book 2.72. Historical Performance Established in March 2015, XT has generated a 3-month return of 0.26 percent. This compares to the category average of -2.26 percent over the same period. XT has underperformed the Technology Select Sector SPDR ETF (NYSEARCA: XLK ) since inception in March 2015. (click to enlarge) Expenses The fund has a total expense ratio of 0.47 percent, which is less than the category average of 0.57 percent. Dividends Thanks to owning many large blue chips, the fund does pay a dividend. The current 30-day SEC yield is 1.36 percent. Outlook The iShares Exponential Technology Fund provides investors with the opportunity to gain exposure to a niche area of the thriving technology sector. XT is a relatively conservative way to play these companies due to the inclusion of blue chip companies across a range of sectors. Although the fund is equally weighted, its smaller cap components should experience larger gains over the long run. The approach of XT is good for conservative investors if it is successful, but may disappoint aggressive investors looking for pure exposure to innovative, cutting-edge technology companies. Editor’s Note: This article discusses one or more securities that do not trade on a major U.S. exchange. Please be aware of the risks associated with these stocks. Disclosure: I/we have no positions in any stocks mentioned, and no plans to initiate any positions within the next 72 hours. (More…) I wrote this article myself, and it expresses my own opinions. I am not receiving compensation for it (other than from Seeking Alpha). I have no business relationship with any company whose stock is mentioned in this article.
Today’s Strong Competitive Wealth-Builder ETF Investment: IYG

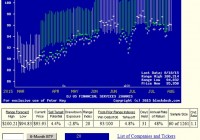
Summary From a population of some 350 actively-traded, substantial, and growing ETFs this is a currently attractive addition to a portfolio whose principal objective is wealth accumulation by active investing. We daily evaluate future near-term price gain prospects for quality, market-seasoned ETFs, based on the expectations of market-makers [MMs], drawing on their insights from client order-flows. The analysis of our subject ETF’s price prospects is reinforced by parallel MM forecasts for each of the ETF’s ten largest holdings. Qualitative appraisals of the forecasts are derived from how well the MMs have foreseen subsequent price behaviors following prior forecasts similar to today’s. Size of prospective gains, odds of winning transactions, worst-case price drawdowns, and marketability measures are all taken into account. Today’s most attractive ETF Is the iShares US Financial Services ETF (NYSEARCA: IYG ) . The investment seeks to track the investment results of an index composed of U.S. equities in the financial services sector. The fund generally invests at least 90% of its assets in securities of the underlying index and in depositary receipts representing securities of the underlying index. It seeks to track the investment results of the Dow Jones U.S. Financial Services Index (the “underlying index”), which measures the performance of the financial services sector of the U.S. equity market. It is a subset of the Dow Jones U.S. Financials Index. The fund is non-diversified. (from Yahoo.Finance.ETF.Profile) The fund currently holds assets of $774 million and has had a YTD price return of +5.49%. Its average daily trading volume of 107,208 produces a complete asset turnover calculation in 75 days at its current price of $95.95. Behavioral analysis of market-maker hedging actions while providing market liquidity for volume block trades in the ETF by interested major investment funds has produced the recent past (6 month) daily history of implied price range forecasts pictured in Figure 1. Figure 1 (used with permission) The vertical lines of Figure 1 are a visual history of forward-looking expectations of coming prices for the subject ETF. They are NOT a backward-in-time look at actual daily price ranges, but the heavy dot in each range is the ending market quote of the day the forecast was made. What is important in the picture is the balance of upside prospects in comparison to downside concerns. That ratio is expressed in the Range Index [RI], whose number tells what percentage of the whole range lies below the then current price. Today’s Range Index is used to evaluate how well prior forecasts of similar RIs for this ETF have previously worked out. The size of that historic sample is given near the right-hand end of the data line below the picture. The current RI’s size in relation to all available RIs of the past 5 years is indicated in the small blue thumbnail distribution at the bottom of Figure 1. The first items in the data line are current information: The current high and low of the forecast range, and the percent change from the market quote to the top of the range, as a sell target. The Range Index is of the current forecast. Other items of data are all derived from the history of prior forecasts. They stem from applying a T ime- E fficient R isk M anagement D iscipline to hypothetical holdings initiated by the MM forecasts. That discipline requires a next-day closing price cost position be held no longer than 63 market days (3 months) unless first encountered by a market close equal to or above the sell target. The net payoffs are the cumulative average simple percent gains of all such forecast positions, including losses. Days held are average market rather than calendar days held in the sample positions. Drawdown exposure indicates the typical worst-case price experience during those holding periods. Win odds tells what percentage proportion of the sample recovered from the drawdowns to produce a gain. The cred(ibility) ratio compares the sell target prospect with the historic net payoff experiences. Figure 2 provides a longer-time perspective by drawing a once-a week look from the Figure 1 source forecasts, back over two years. Figure 2 (used with permission) What does this ETF hold, causing such price expectations? Figure 3 is a list of securities held by the subject ETF, indicating its concentration in the top ten largest holdings, and their percentage of the ETF’s total value. Figure 3 Source: Yahoo Finance IYG Concentrates 60% of its assets in its top ten commitments. This provides a responsive measure of the action of market prices of stocks in this essential sector. The major holdings are all established, dominant participants in the financial services industry. Figure 4 is a table of data lines similar to that contained in Figure 1, for each of the top ten holdings of IYG. For convenience, the IYG data itself is included. Figure 4 (click to enlarge) Column (5) contains the upside price change forecasts between current market prices (4) and the upper limit of prices (2), regarded by MMs as being worth paying for protection from adverse price change. The average of +7.2% of the top ten IYG holdings is well above the market-average proxy of SPY of +5.3%. Diversification of IYG’s other 40% of holdings damps its overall upside (as MMs see it) to only +4.4%. But in the same stroke the risk side of the equation in (6) for IYG is brought down to worst-case price drawdowns of -2.8%, below the defensive market-tracking ETF SPY norm of -3.2%. In an environment many consider imbued with high market risk, IYG may provide a very attractive balance. The ability of IYG holdings to recover from those worst-case drawdowns and achieve profits (8) occurred in 93% of experiences. The equity population only recovered less than two thirds of the time, and while the SPY experiences were more consistent, the achieved gains were much smaller. SPY has had only +3.5% gains previously from like forecasts of +5.3%. Another qualitative consideration is the credibility of IYG after previous forecasts like today’s. Its net average price change gain (column 9) has been 1.1 times the size of the upside forecast average, +4.8% compared to +4.4%. The equity population’s actual price gain achievement, net of losses has been a pitiful +3.2% compared to promises of 13.5%. Conclusion IYG provides attractive forecast price gains, supported by its equally appealing largest holdings. Both the ETF and many of its major holdings offer very attractive prospects in near-term price behaviors, demonstrated by previous experiences following prior similar forecasts by market makers. But it may be considered a defensive commitment in the face of widespread anticipation of further market weakness. A more constructive strategy would be to seek out individual stock opportunities offering odds-on achievement of low double-digit price gains where past similar forecasts encountered only small worst-case price drawdowns during their relatively short holding periods en route to sell targets. The blue summary row of Figure 3 labeled “20 best odds forecasts” tells what the current top-ranked wealth-building opportunities are offering, as a comparative competitive norm. YTD in 2015, 2062 of these 20-a-day list members have reached closeouts in an average of 2-month holding periods, providing a +30% annual rate of average price-change gains. Disclosure: I/we have no positions in any stocks mentioned, and no plans to initiate any positions within the next 72 hours. (More…) I wrote this article myself, and it expresses my own opinions. I am not receiving compensation for it (other than from Seeking Alpha). I have no business relationship with any company whose stock is mentioned in this article.

Is There Anything To Be Read Into Ford’s Decision To Dump Fidelity Contrafund From Its 401(k)?

Summary Ford announced last week that it’s dropping Fidelity Contrafund from its 401(k) plan lineup. Fidelity Contrafund has about $113B in total assets. $900M of that comes from the Ford retirement plan. While Fidelity Contrafund is going, the Fidelity Growth Company fund is staying as a plan option. Contrafund’s track record under manager Will Danoff coupled with its low expenses and risk make it a curious choice to be dropped from a retirement plan. It’s not often that the relatively mundane topic of 401(k) investment options makes it into the news but we had one of those instances last week when Ford (NYSE: F ) announced that it was dumping the ultra-popular Fidelity Contrafund (MUTF: FCNTX ) from its 401(k) lineup. Given the fund’s popularity and performance, it seems to be a bit of a curious move. When it comes down to swapping out investment choices in a retirement plan it’s usually due to one of three reasons – below average performance, above average cost or management changes. But looking at Contrafund none of those factors seems to be a reason. Will Danoff has been managing the fund for the past 25 years (as well as a handful of other smaller Fidelity funds during parts of that time frame but Contrafund is clearly the big dog) and his performance record over the course of the last two and a half decades has been nothing short of stellar. Contrafund is currently beating the S&P 500 during the past 1-year, 3-year, 5-year, 10-year and 15-year time frames in addition to doubling the index’s performance year to date. Seems like the type of performance and track record you’d want available in a retirement plan. From a cost standpoint, the current expense ratio doesn’t appear to be a big issue either. The fund’s current net expense ratio of 0.64% compares favorably to other funds in its category and, in fact, has been dropping annually over the last several years. Looking at risk levels , the fund’s beta is currently less than 1 indicating below average risk and according to Morningstar’s own risk rating categorizes, the fund’s risk is either “below average” or “low” depending on the time frame considered. It just doesn’t seem that there are any glaring red flags with this fund. Mainstay Capital, which administers the Ford 401(k) program, states on its website that it simply is ” removing one of the funds” from the plan without naming which one specifically (although it does link to an article explaining that Contrafund is the one being axed). For its part, Ford has said simply that it makes changes “from time to time.” While Contrafund is going, its counterpart, the Fidelity Growth Company (MUTF: FGCKX ) fund, is staying although to be fair, its performance is similarly strong like Contrafund. Contrafund is a $113B behemoth so the estimated $900M outflow the fund will experience thanks to Ford’s withdrawal shouldn’t affect management of the fund in any type of meaningful way. Conclusion It’s a bit odd to think that Ford would drop a fund as popular and well performing as Contrafund but that’s what’s happening. Perhaps the powers that be at Ford feel that Contrafund and Growth Company have overlapping management styles and objectives and are eliminating one as a cost savings measure (Ford has announced that Contrafund won’t be replaced). In that case, Contrafund’s dismissal makes some sense. With other Fidelity funds remaining, one would have to assume there isn’t any type of relationship issue between Ford and Fidelity. My conclusion is that there isn’t really anything to read into this decision. Although this plan change happens to feature one of the biggest and best-known names in the mutual fund world, it appears that more than likely this is simply just part of the normal course of business for Ford. Disclosure: I am/we are long F. (More…) I wrote this article myself, and it expresses my own opinions. I am not receiving compensation for it (other than from Seeking Alpha). I have no business relationship with any company whose stock is mentioned in this article.